Fig. 8.
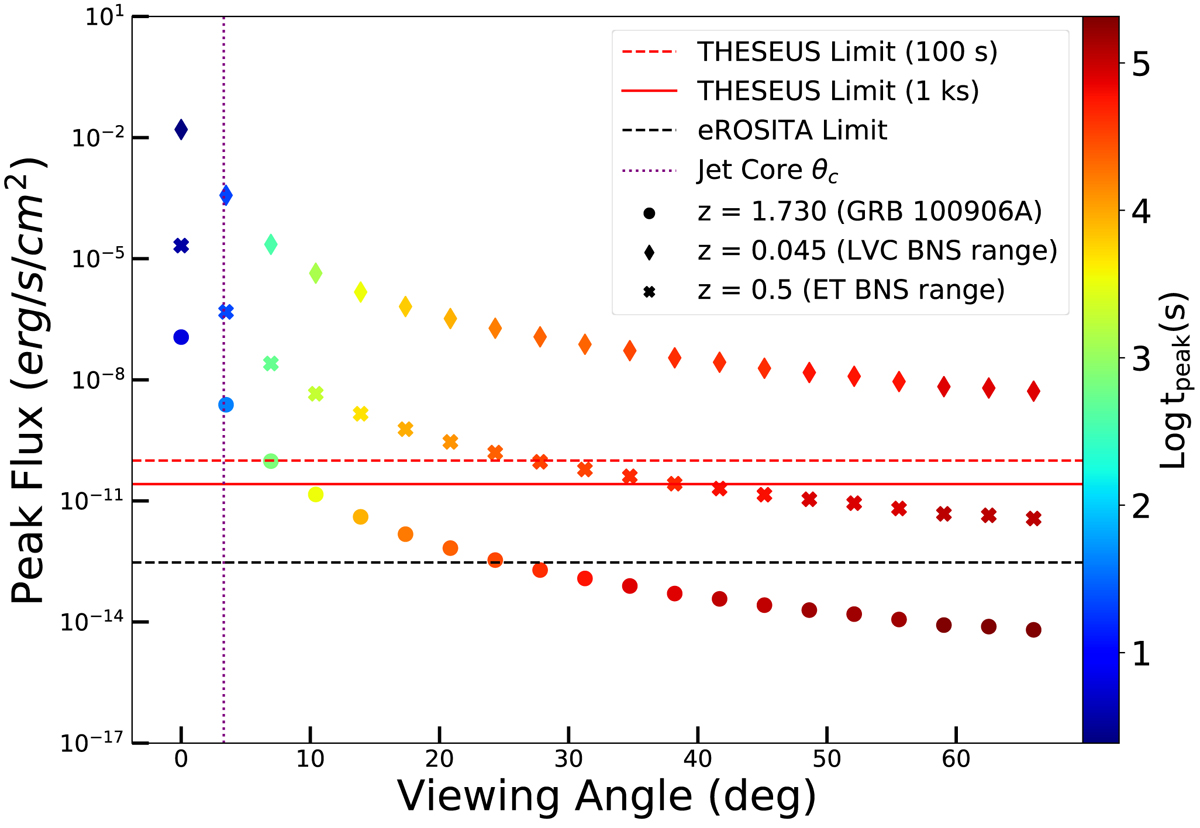
Peak flux vs. viewing angle of the HLE of GRB 100906A assuming the same structure derived in O20. Circles, diamonds, and crosses represent the same model at three different redshifts: z = 1.730 (actual redshift of GRB 100906A), z = 0.045 (Advanced LIGO and Virgo range for BNS mergers), and z = 0.5 (ET range for BNS mergers), respectively. The color code denotes the logarithm of the time of the peak in the observer frame. Red continuous and red dashed lines mark the flux limit of THESEUS-SXI integrated in 103 s and 102 s, respectively. Black dashed line marks the flux limit of eROSITA integrated in 40 s. Verical dotted line marks θc.
Current usage metrics show cumulative count of Article Views (full-text article views including HTML views, PDF and ePub downloads, according to the available data) and Abstracts Views on Vision4Press platform.
Data correspond to usage on the plateform after 2015. The current usage metrics is available 48-96 hours after online publication and is updated daily on week days.
Initial download of the metrics may take a while.