Fig. 5.
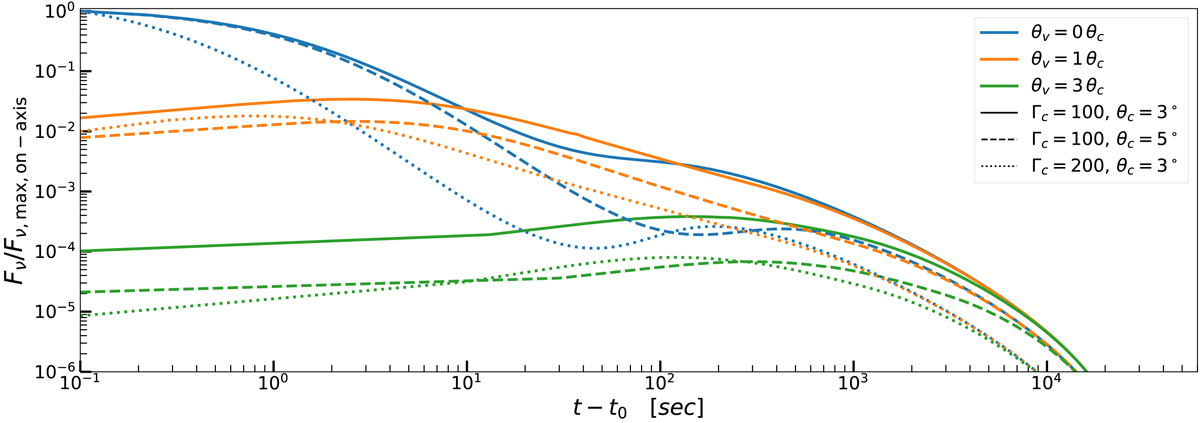
Light curves obtained varying Γc and θc at fixed R0 = 1015 cm, at different viewing angles. Light curves corresponding to viewing angles θv = 0, θc, 3θc are shown in blue, orange, and green, respectively. Continuous curves denote the fiducial model, with Γc = 100, θc = 3°. The structure is Gaussian and the spectrum is a SBPL function with αs = 0.2 and βs = 1.3. The light curves are those at ν = 10 keV normalized to the maximum value of the on-axis case and the time is relative to the time of arrival of the first photon. For better visualization, we translated the time such that the first photons arrive at 10−1 s.
Current usage metrics show cumulative count of Article Views (full-text article views including HTML views, PDF and ePub downloads, according to the available data) and Abstracts Views on Vision4Press platform.
Data correspond to usage on the plateform after 2015. The current usage metrics is available 48-96 hours after online publication and is updated daily on week days.
Initial download of the metrics may take a while.