Fig. 3.
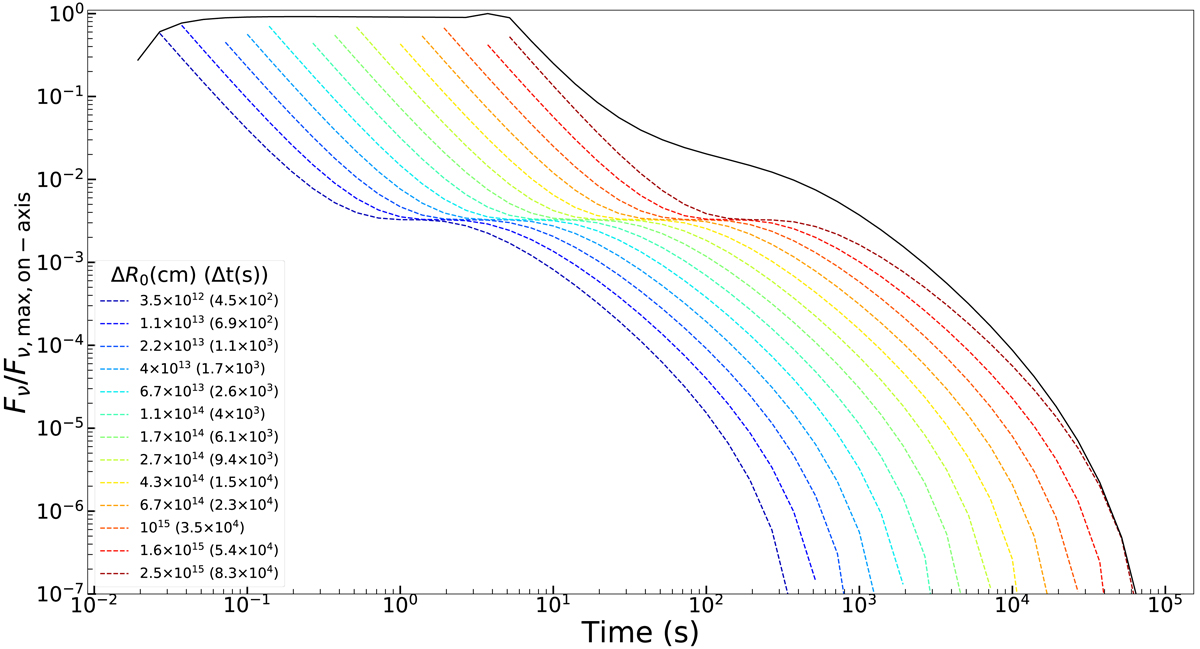
Light curve for finite-duration emission. The case refers to an on-axis observer. The dashed colored light curves corresponding to n = 13 selected infinitesimal pulses out of the total N = 105 composing the finite-duration emission episode. Partial fluxes have been multiplied by a factor N/n in order to better visualize the contribution to the final emission at different radii. Colors identify the ΔR0, i (Δt) with respect to the initial R0 (tem) at which the first pulse is emitted. The black solid line is the final light curve made by the sum of the partial ones. We assume a Gaussian jet with parameters Γc = 100, θc = θE = 3°, R0 = 1013 cm and the pulse duration in the CoE frame ΔT = 105 s. A SBPL spectrum with αs = 0.2 and βs = 1.3 is assumed.
Current usage metrics show cumulative count of Article Views (full-text article views including HTML views, PDF and ePub downloads, according to the available data) and Abstracts Views on Vision4Press platform.
Data correspond to usage on the plateform after 2015. The current usage metrics is available 48-96 hours after online publication and is updated daily on week days.
Initial download of the metrics may take a while.