Fig. 2.
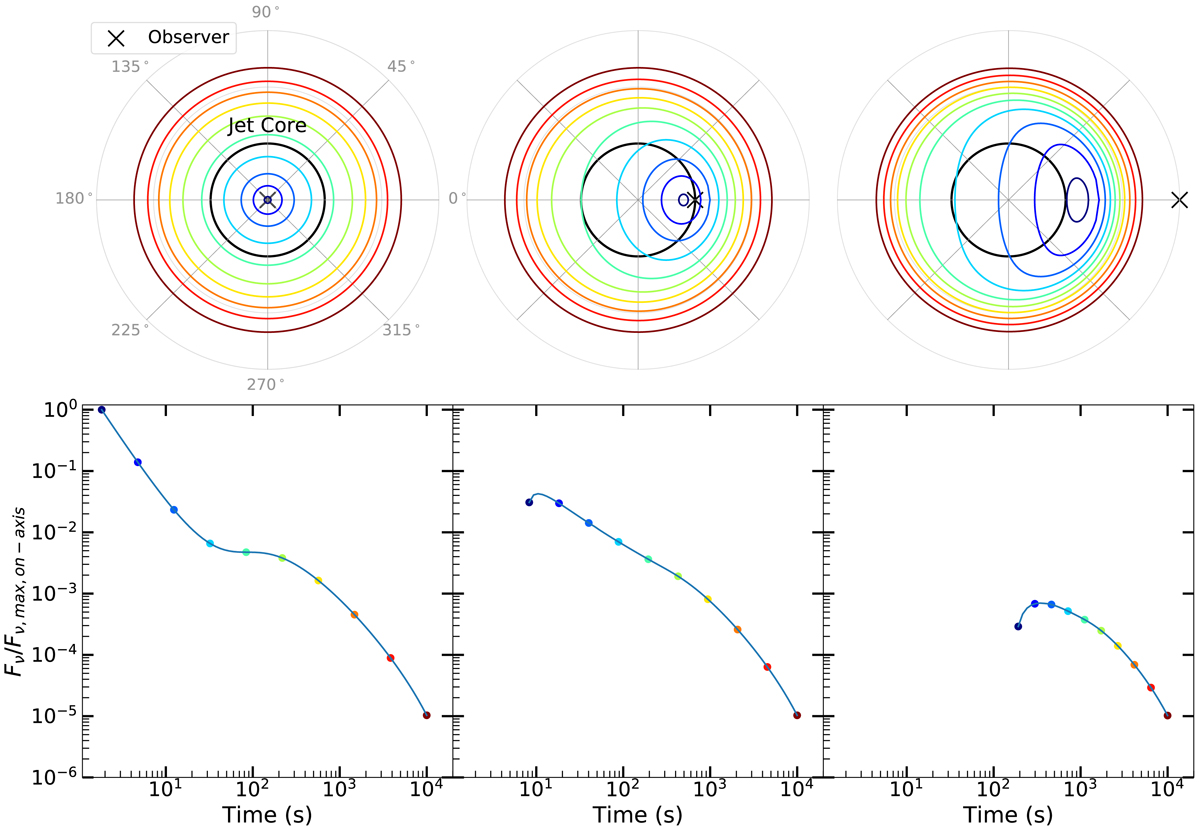
Equal arrival time rings (top panels) and corresponding light curves (bottom panels) for three configurations of the viewing angle (from left to right), θv = 0° (on-axis), θv = θc (edge-of-the-core), and θv = 3 × θc (off-axis). Top panels: polar plot of the emitting surface. The black circle shows the physical limit of the core of the jet. The black cross shows the observer line of sight. The colored curves are the EATRs at ten arbitrary sampling times. Bottom panels: light curve normalized at its maximum value (corresponding to the on-axis observer at the first sampled epoch). The colored dots represent the flux emitted by the corresponding colored EATRs in the top panel. The structured jet assumed for this test case has a Gaussian structure with Γc = 100, θc = θE = 3°, R0 = 1015 cm. The comoving emission spectrum is described by a SBPL spectrum with αs = 0.2 and βs = 1.3.
Current usage metrics show cumulative count of Article Views (full-text article views including HTML views, PDF and ePub downloads, according to the available data) and Abstracts Views on Vision4Press platform.
Data correspond to usage on the plateform after 2015. The current usage metrics is available 48-96 hours after online publication and is updated daily on week days.
Initial download of the metrics may take a while.