Fig. 8.
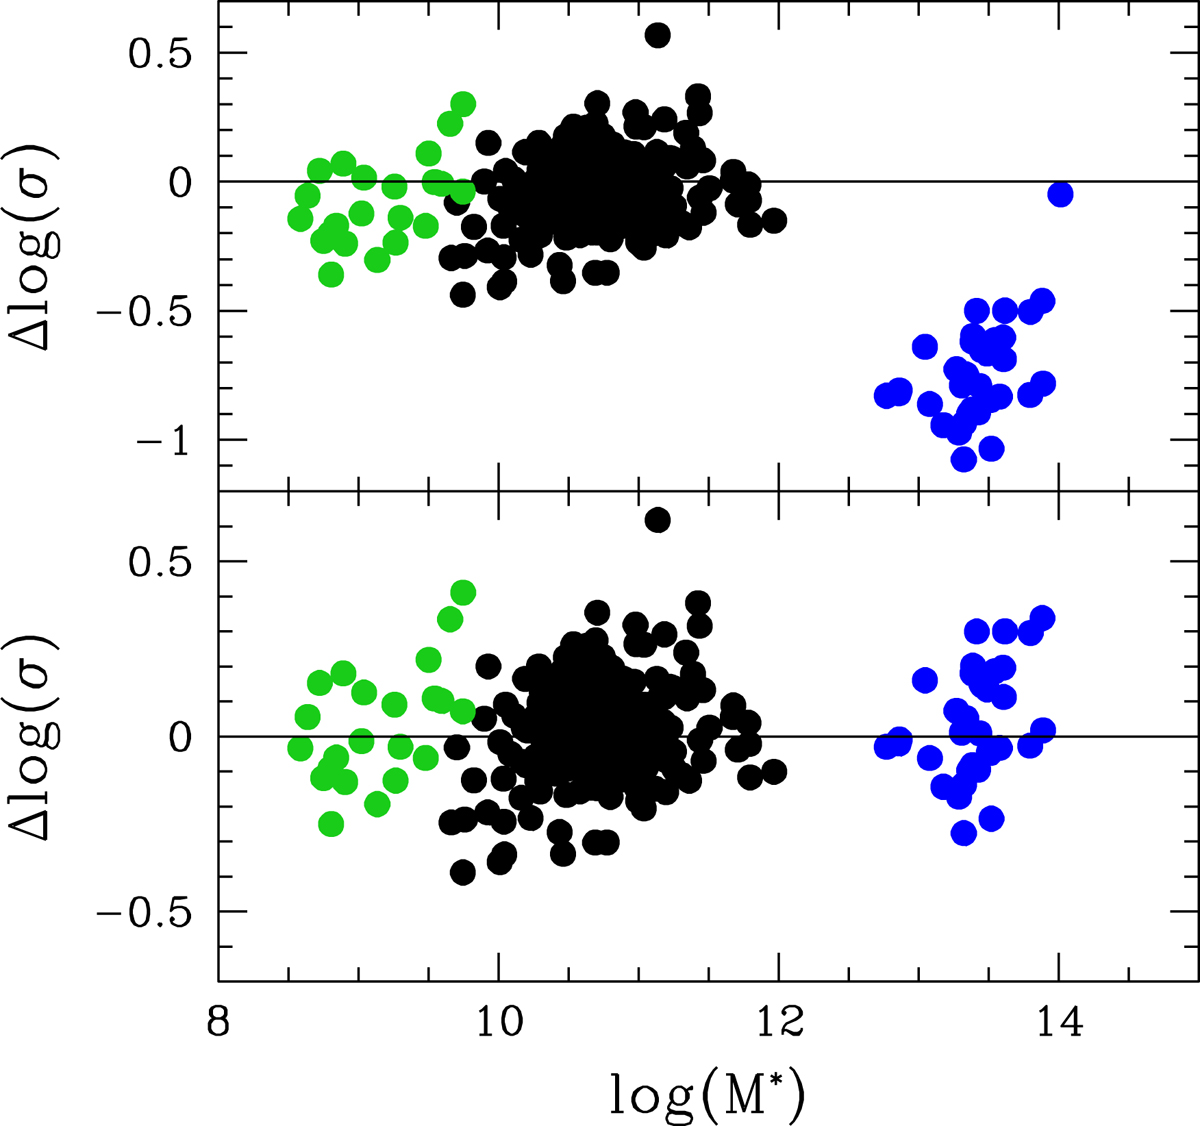
Stellar mass vs. difference in log units of the velocity dispersion measured from spectra and calculated through the virial equation. Upper panel: difference before the correction of the stellar mass. Lower panel: indicates that once the mass is corrected for the contribution of DM the two quantities are in good agreement (see text). Black dots are normal ETGs, green dots the faint ETGs measured by Bettoni et al. (2016), blue dots are galaxy clusters.
Current usage metrics show cumulative count of Article Views (full-text article views including HTML views, PDF and ePub downloads, according to the available data) and Abstracts Views on Vision4Press platform.
Data correspond to usage on the plateform after 2015. The current usage metrics is available 48-96 hours after online publication and is updated daily on week days.
Initial download of the metrics may take a while.