Fig. 7.
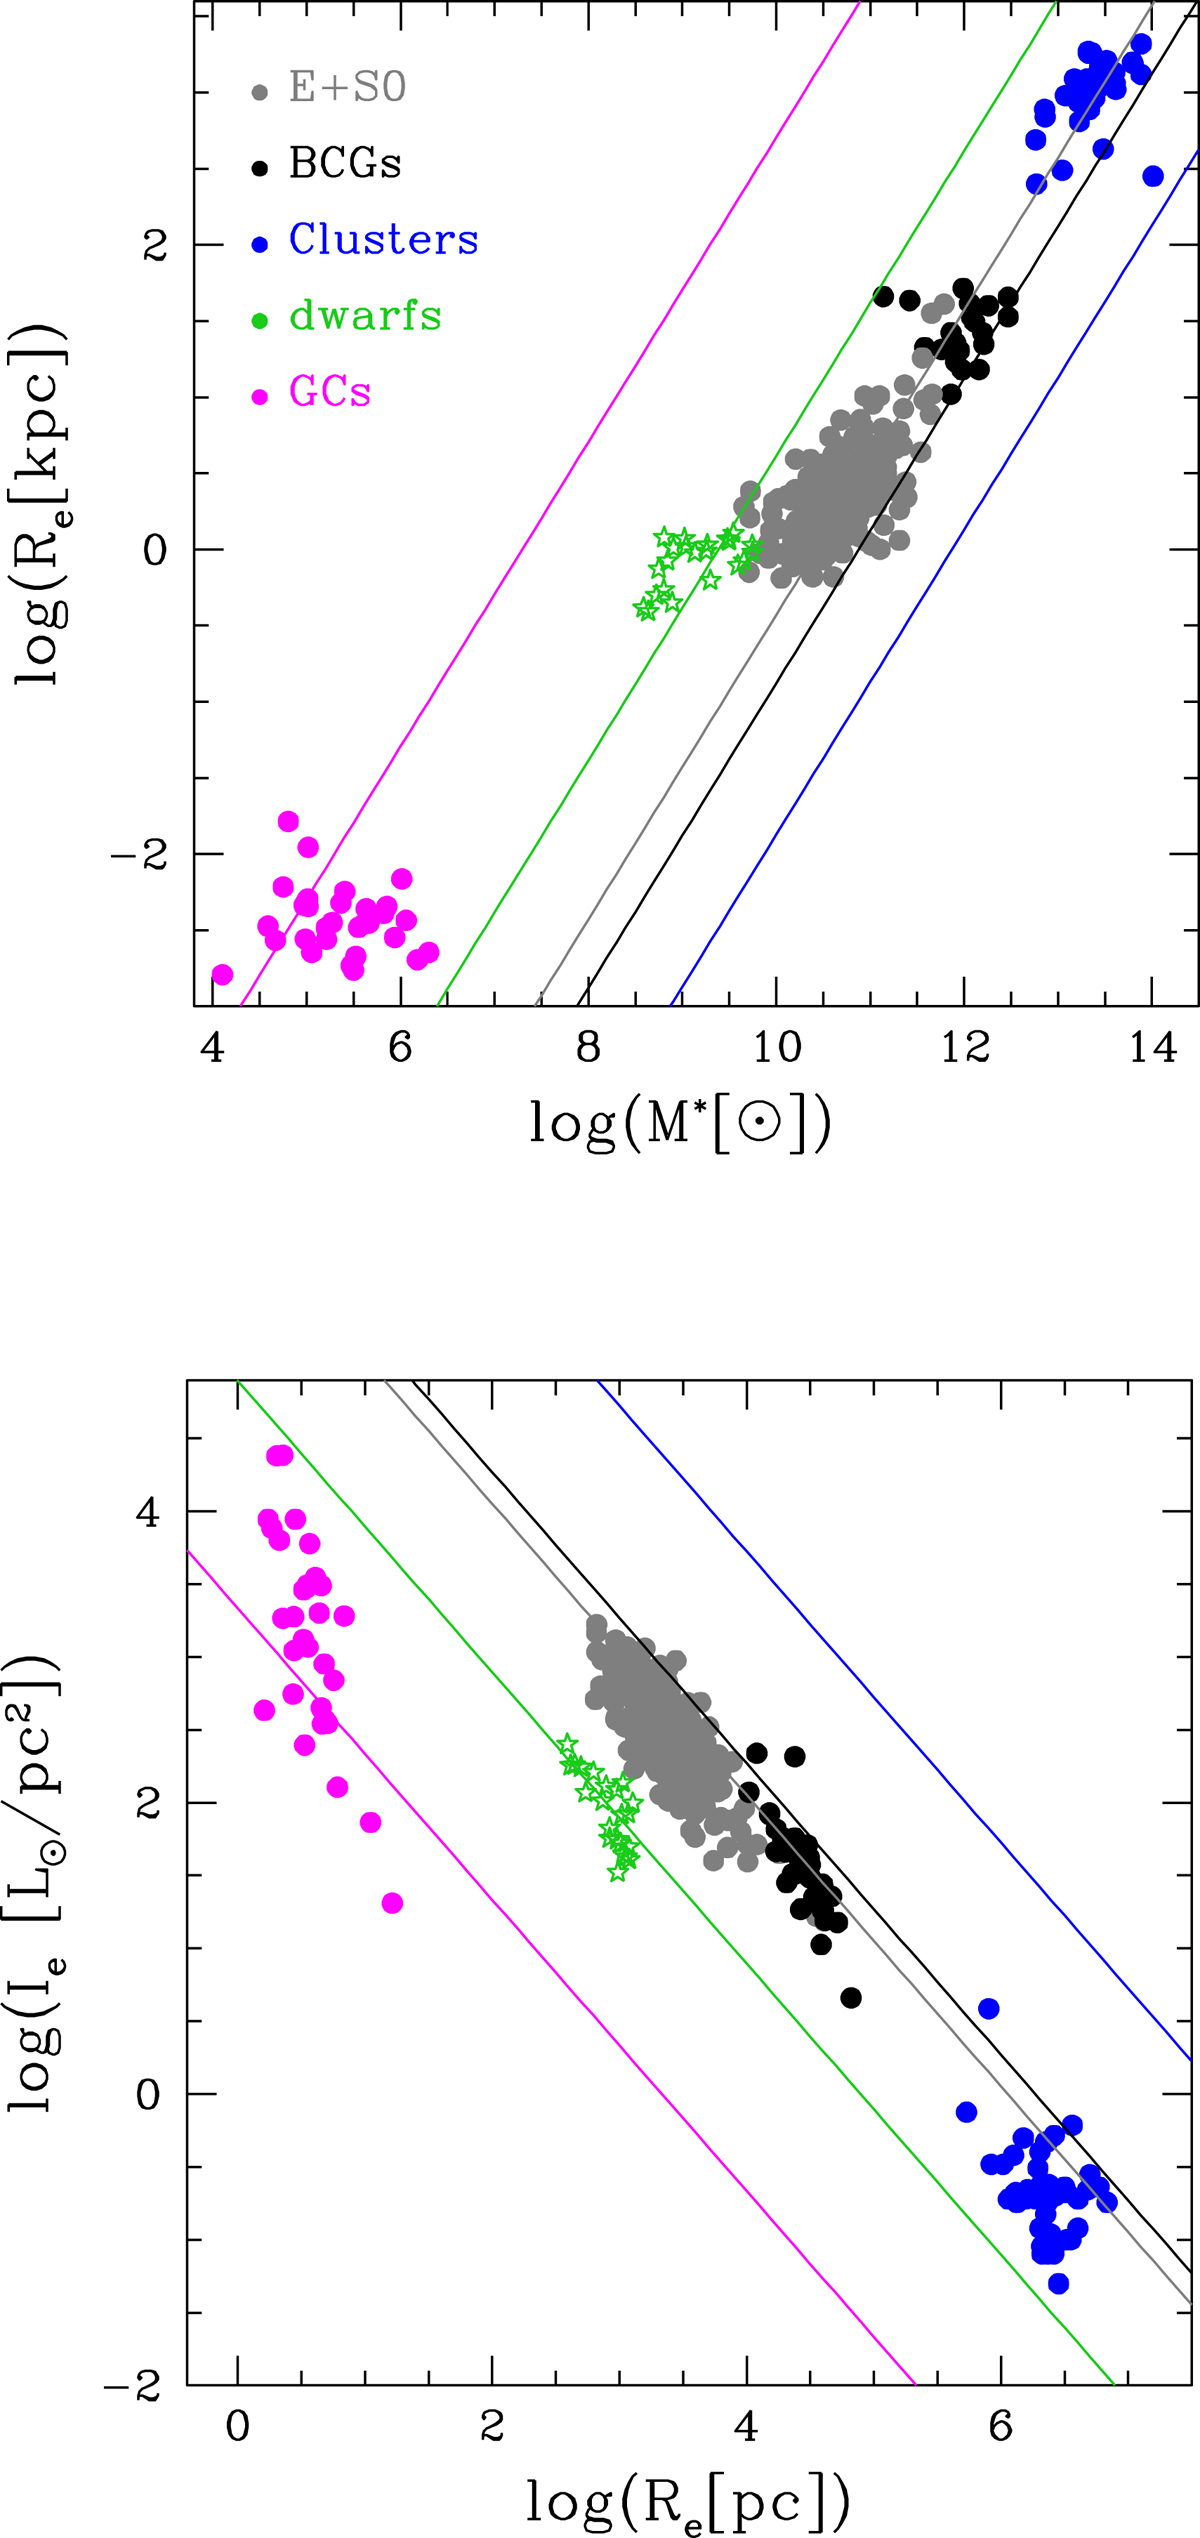
Upper panel: log(Re)−log(M*) plane. GCs are shown as magenta dots, dwarfs as green stars, normal ETGs as gray dots, BCGs as black dots, and clusters as blue dots. Each colored line indicates the average zero point of the systems calculated from Eqs. (1) and (5) with the values of kv, M*/L, and σ. The solid black line is obtained for the sample of galaxies and clusters taken together. All the lines have the slope 1 predicted for virialized systems. Lower panel: log(⟨I⟩e)−log(Re) plane. The same color-coding is adopted. Here the slope of the lines is −1.
Current usage metrics show cumulative count of Article Views (full-text article views including HTML views, PDF and ePub downloads, according to the available data) and Abstracts Views on Vision4Press platform.
Data correspond to usage on the plateform after 2015. The current usage metrics is available 48-96 hours after online publication and is updated daily on week days.
Initial download of the metrics may take a while.