Fig. 4.
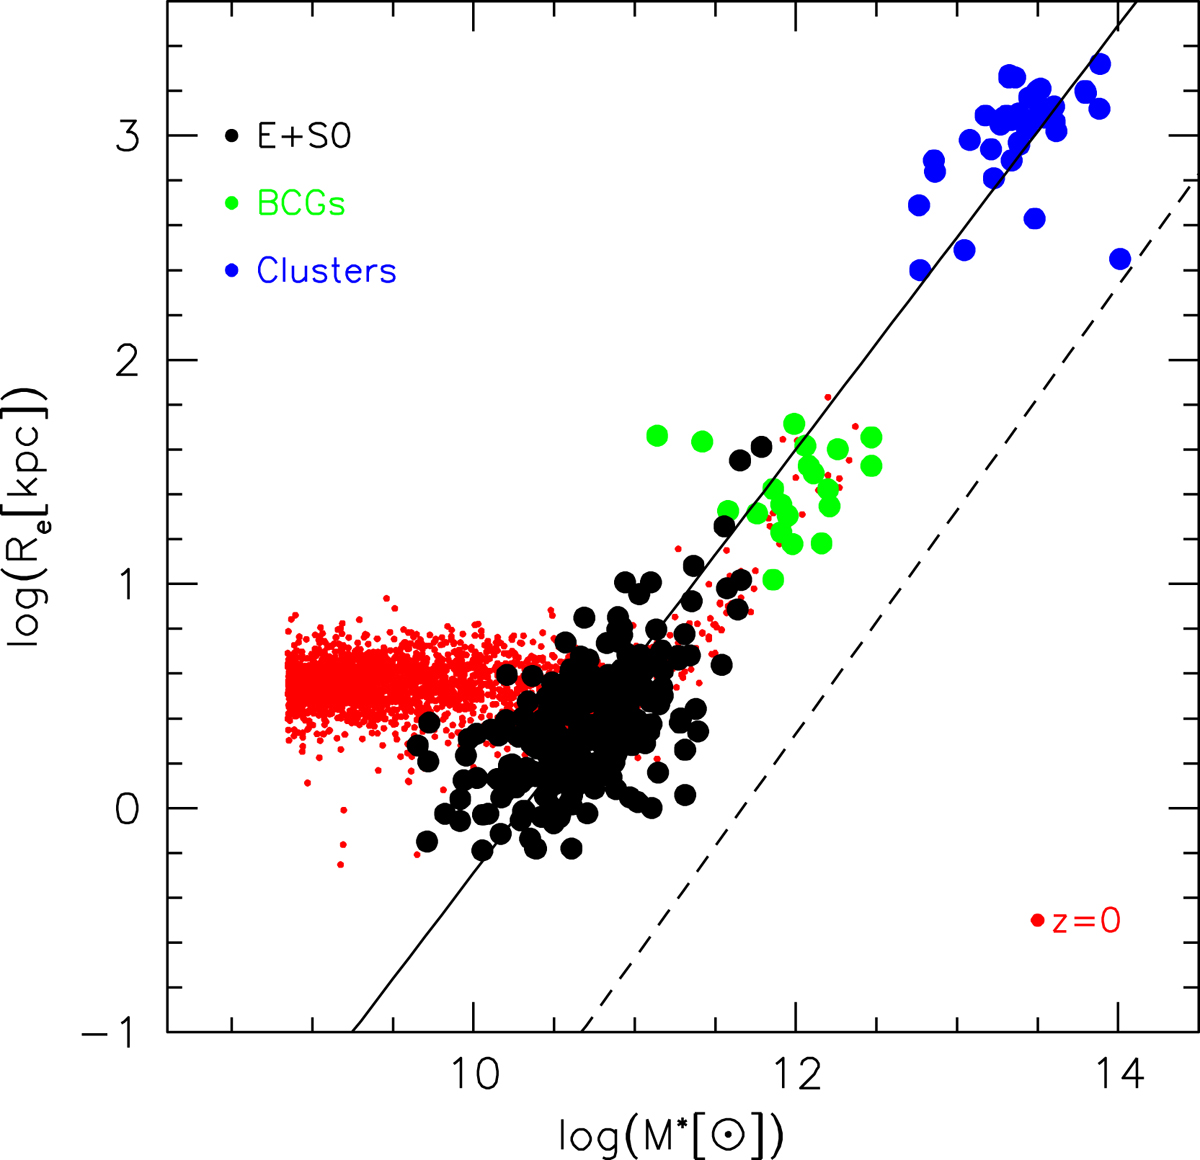
Distributions in the log(Re)−log(M*) plane for normal ETGs (black filled circles), BCGs (green filled circles), and clusters of galaxies (blue filled circles) from our WINGS samples. The red small dots show the data of the Illustris simulations for galaxies at z = 0. The solid line is the fit of the galaxies and cluster sample, while the dashed line is the slope predicted from the virial theorem for a possible ZoE.
Current usage metrics show cumulative count of Article Views (full-text article views including HTML views, PDF and ePub downloads, according to the available data) and Abstracts Views on Vision4Press platform.
Data correspond to usage on the plateform after 2015. The current usage metrics is available 48-96 hours after online publication and is updated daily on week days.
Initial download of the metrics may take a while.