Fig. 3.
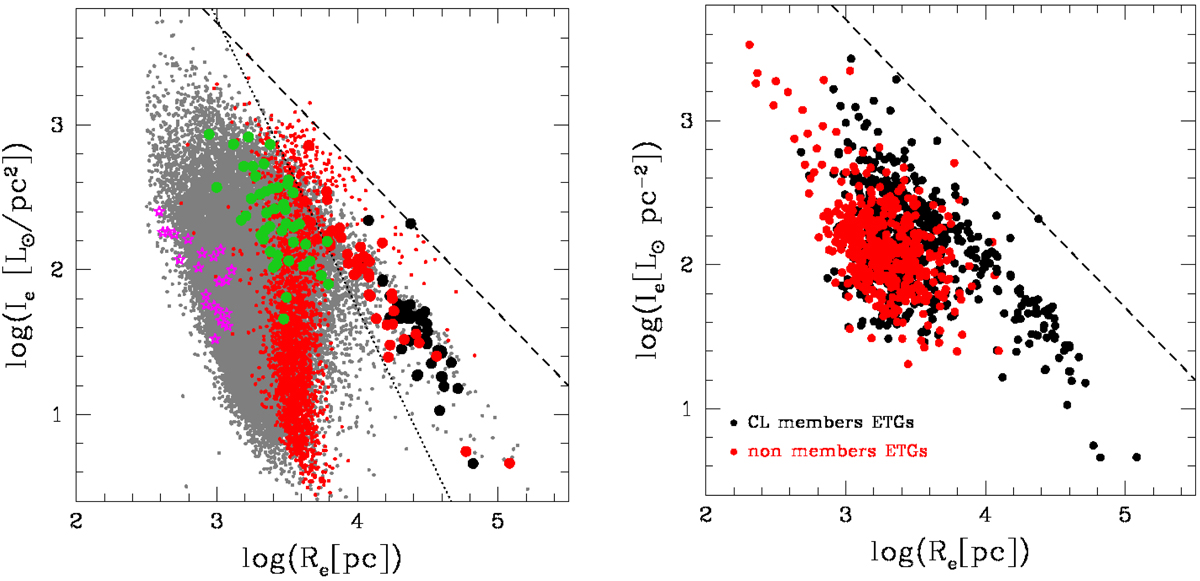
Left panel: enlargement of the log(⟨I⟩e)−log(Re) plane with real and simulated galaxies. Black filled circles indicate our BCGs, red filled circles our II-BCGs, green filled symbols our random sample of normal ETGs, gray filled dots the WINGS ETGs of D’Onofrio et al. (2017), empty stars the faint ETGs of Bettoni et al. (2016), and filled circles our clusters. The small red dots are used for the whole set of Illustris galaxies at z = 0. In this case the effective mass radius is assumed to be equal to the effective radius. The dotted line is that expected for systems of luminosity MV = −21.5. Right panel: log(⟨I⟩e)−log(Re) plane for cluster (black dots) and non-cluster (red dots) ETGs. Shown is the subsample of galaxies with available masses from Fritz et al. (2007). In both panels the dashed lines are the trends for virialized systems with slope −1 and a zero point of a possible ZoE.
Current usage metrics show cumulative count of Article Views (full-text article views including HTML views, PDF and ePub downloads, according to the available data) and Abstracts Views on Vision4Press platform.
Data correspond to usage on the plateform after 2015. The current usage metrics is available 48-96 hours after online publication and is updated daily on week days.
Initial download of the metrics may take a while.