Fig. 2.
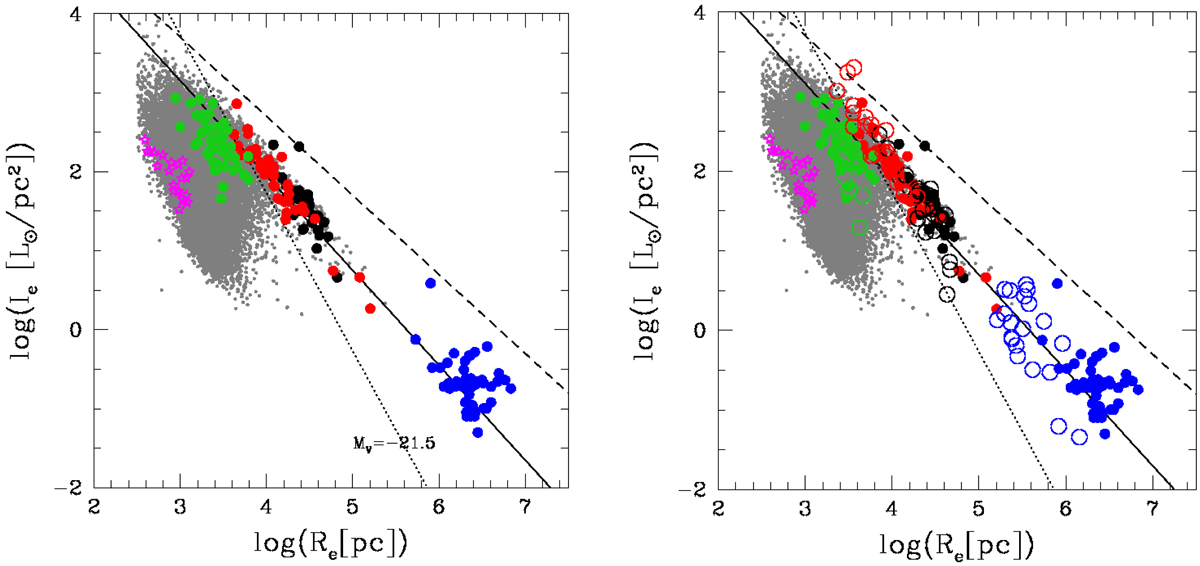
Left panel: distribution of galaxies and clusters in the log(⟨I⟩e)−log(Re) plane. Black filled circles indicate our BCGs, red filled circles our II-BCGs, green filled circles our random sample of normal ETGs, gray filled dots the 34982 galaxies analyzed by D’Onofrio et al. (2014) with GASPHOT, empty magenta stars the faint ETGs of Bettoni et al. (2016), and filled blue circles our clusters. The dashed line with slope −1 is that predicted for virialized systems for a possible ZoE. The zero point of this line was chosen as explained in Sect. 4.4. The dotted line is that expected for systems of equal luminosity MV = −21.5 with slope −2. The solid line with slope −1.2 is that obtained by Capaccioli et al. (1992). Right panel: log(⟨I⟩e)−log(Re) plane with real and simulated objects. The color-coding and symbols are the same as before. The open circles with the same colors of real galaxies are used for simulated objects. The plotted lines are the same as in left panel.
Current usage metrics show cumulative count of Article Views (full-text article views including HTML views, PDF and ePub downloads, according to the available data) and Abstracts Views on Vision4Press platform.
Data correspond to usage on the plateform after 2015. The current usage metrics is available 48-96 hours after online publication and is updated daily on week days.
Initial download of the metrics may take a while.