Free Access
Fig. 13.
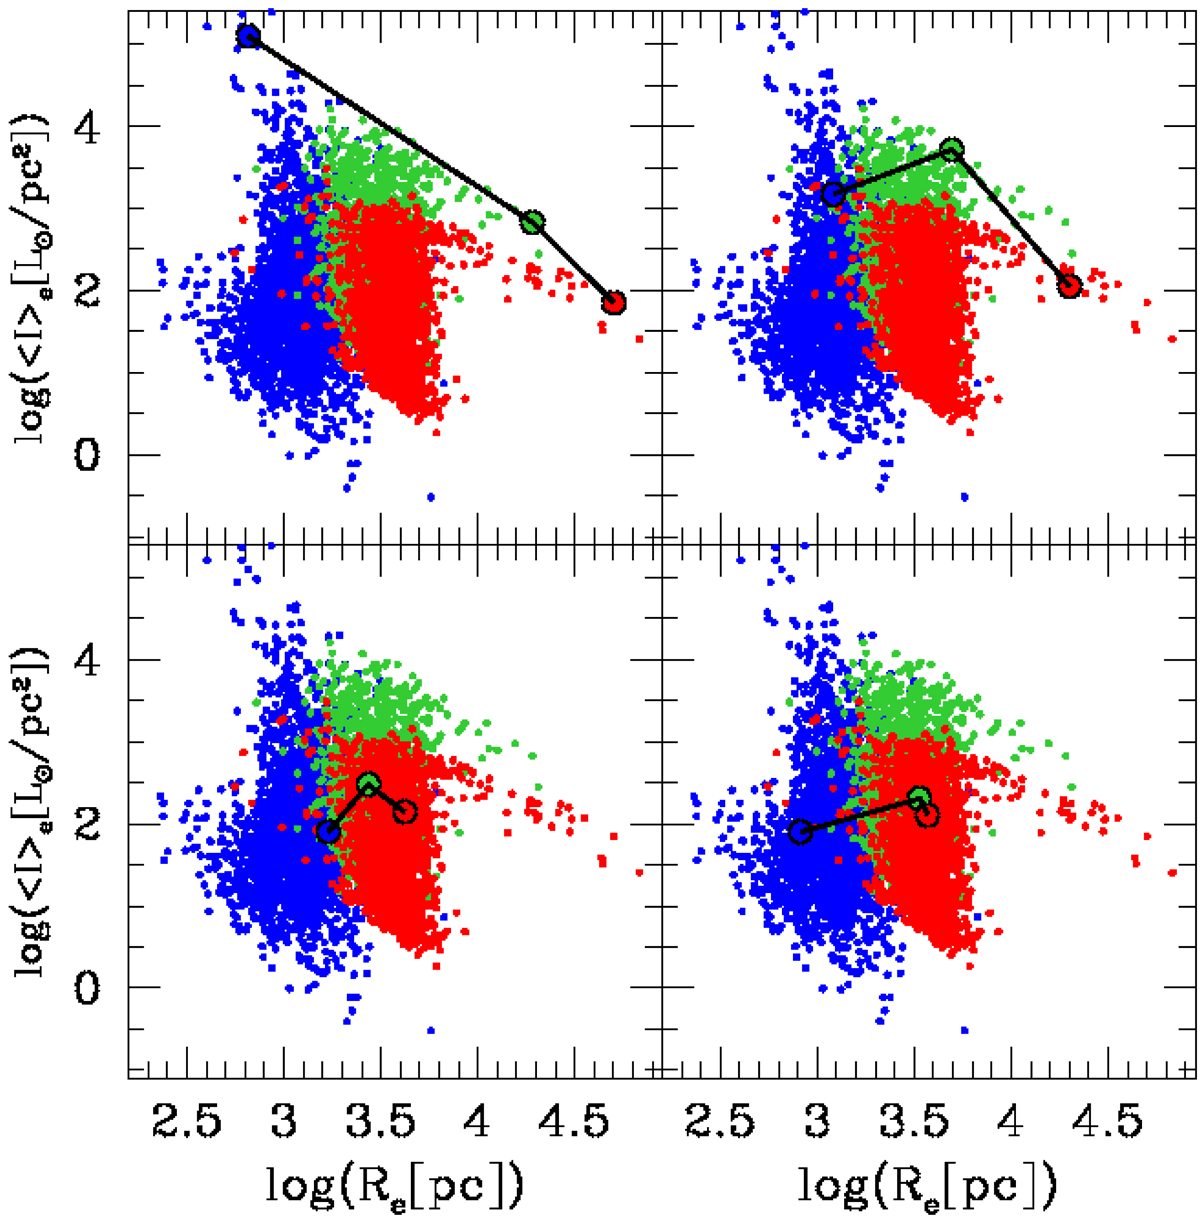
Four different paths in the log(⟨I⟩e) −log(Re) plane resulting from simulated data. Blue dots give the distribution at z = 4, green at z = 1, and red at z = 0. The half-mass radius in parsecs is assumed to be equal to the effective radius. The black lines connect the same object at different epochs.
Current usage metrics show cumulative count of Article Views (full-text article views including HTML views, PDF and ePub downloads, according to the available data) and Abstracts Views on Vision4Press platform.
Data correspond to usage on the plateform after 2015. The current usage metrics is available 48-96 hours after online publication and is updated daily on week days.
Initial download of the metrics may take a while.