Fig. 12.
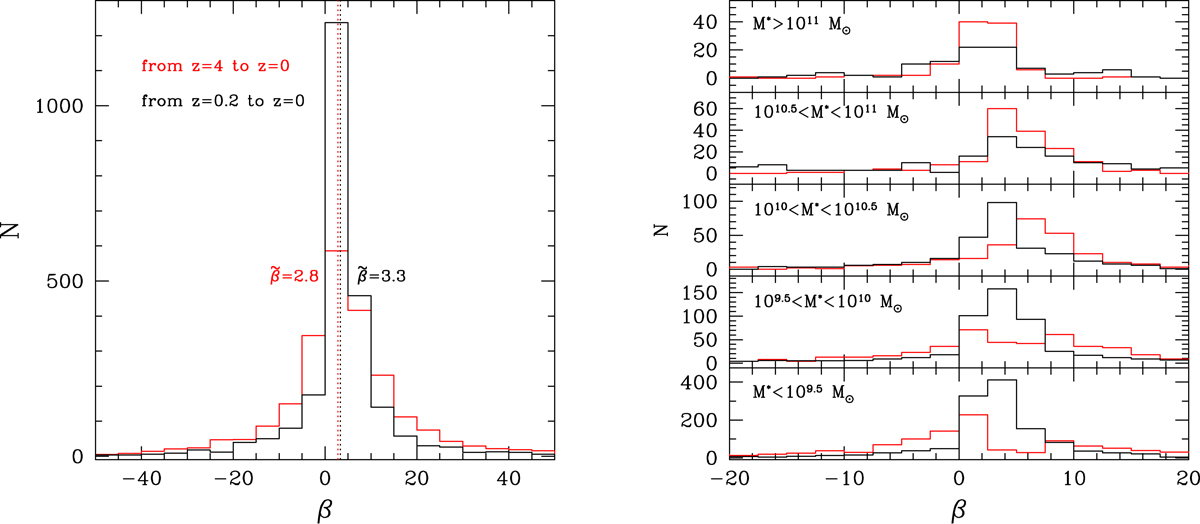
Left panel: distribution of the slope β for the whole sample of galaxies. The red histogram shows the values of β measured from z = 4 to z = 1, the black histogram from z = 0.2 to z = 0. The dashed lines give the medians of the distributions. Right panel: distribution of the slope β for the galaxies of different masses. The red histogram shows the values of β measured from z = 4 to z = 0, the black histogram from z = 0.2 to z = 0.
Current usage metrics show cumulative count of Article Views (full-text article views including HTML views, PDF and ePub downloads, according to the available data) and Abstracts Views on Vision4Press platform.
Data correspond to usage on the plateform after 2015. The current usage metrics is available 48-96 hours after online publication and is updated daily on week days.
Initial download of the metrics may take a while.