Fig. 1.
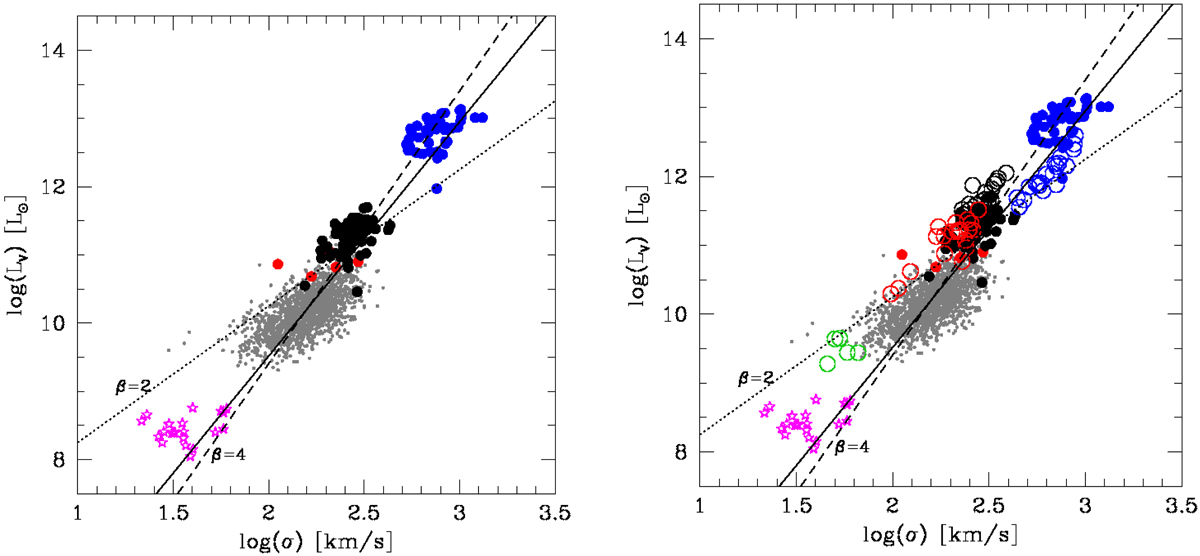
Left panel: distribution of ETGs and clusters in the log(L)−log(σ) plane. Black filled circles indicate our BCGs, red filled circles our II-BCGs, small gray filled circles the 1729 normal ETGs used by D’Onofrio et al. (2017) to study the FP, gray empty stars the faint ETGs of Bettoni et al. (2016), and blue filled circles our clusters. The normal ETGs reanalyzed in Paper I are not shown because their sigma values are not available. The black solid line gives the best fit of the whole dataset obtained with the orthogonal method. The dotted line shows the L ∝ σ2 law predicted for virial systems, while the dashed line gives the L ∝ σ4 FJ slope. Error bars are not shown because they are approximately as big as the plotted filled circles. Right panel: log(L)−log(σ) plane for real and simulated objects. The color-coding and symbols are the same as before. The open circles are used for simulated objects using the same color-coding. The plotted lines are the same as in the left panel.
Current usage metrics show cumulative count of Article Views (full-text article views including HTML views, PDF and ePub downloads, according to the available data) and Abstracts Views on Vision4Press platform.
Data correspond to usage on the plateform after 2015. The current usage metrics is available 48-96 hours after online publication and is updated daily on week days.
Initial download of the metrics may take a while.