Fig. 8
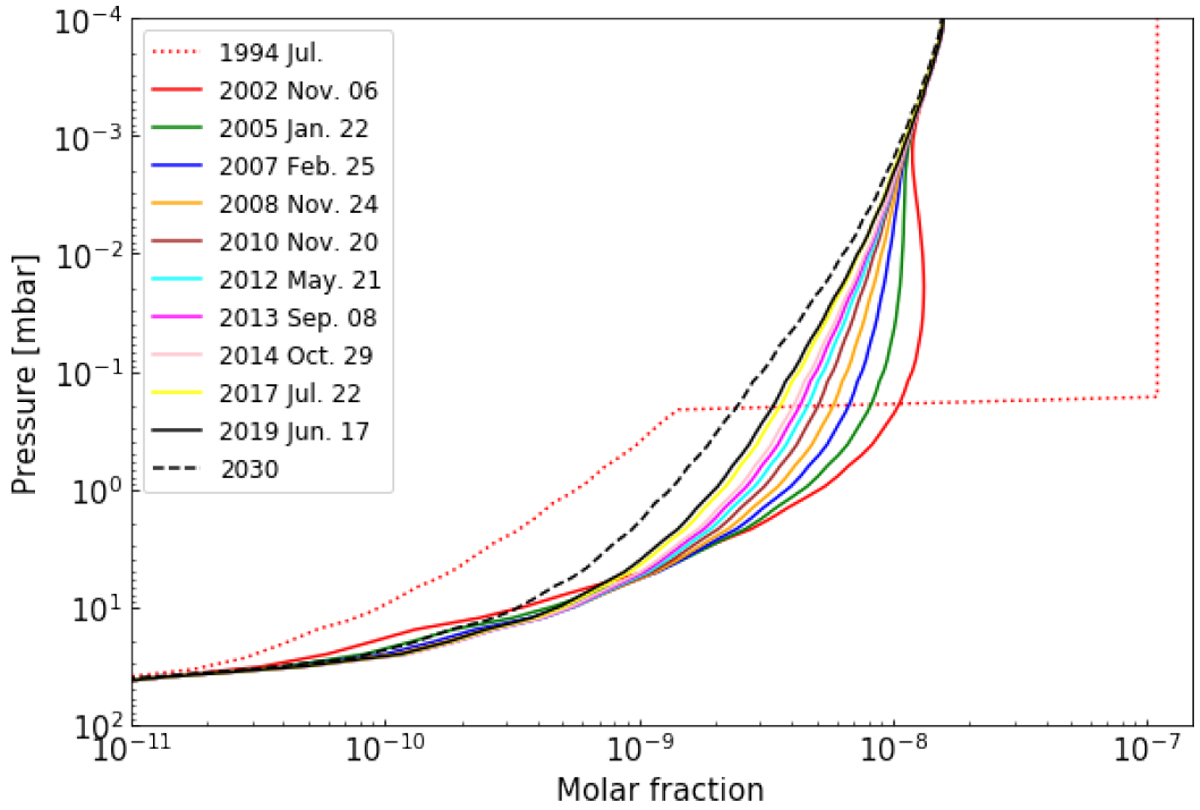
Evolution of the H2O abundance profile in the stratosphere of Jupiter for y0 = 1.1 × 10⁻⁷ above a pressure level p0 = 0.2 mbar (SL9 parameters) and Kzz Model B. These profiles are obtained from the photochemical model and a comparison with the observations. The red dotted abundance profile represents the initial profile of H2O at the time of the SL9 comet impacts in 1994. Each solid curve represents the abundance profile of H2O at dates corresponding to Odin observations. The black dashed profile represents the abundance of H2O that we predict for 2030.
Current usage metrics show cumulative count of Article Views (full-text article views including HTML views, PDF and ePub downloads, according to the available data) and Abstracts Views on Vision4Press platform.
Data correspond to usage on the plateform after 2015. The current usage metrics is available 48-96 hours after online publication and is updated daily on week days.
Initial download of the metrics may take a while.