Fig. 6
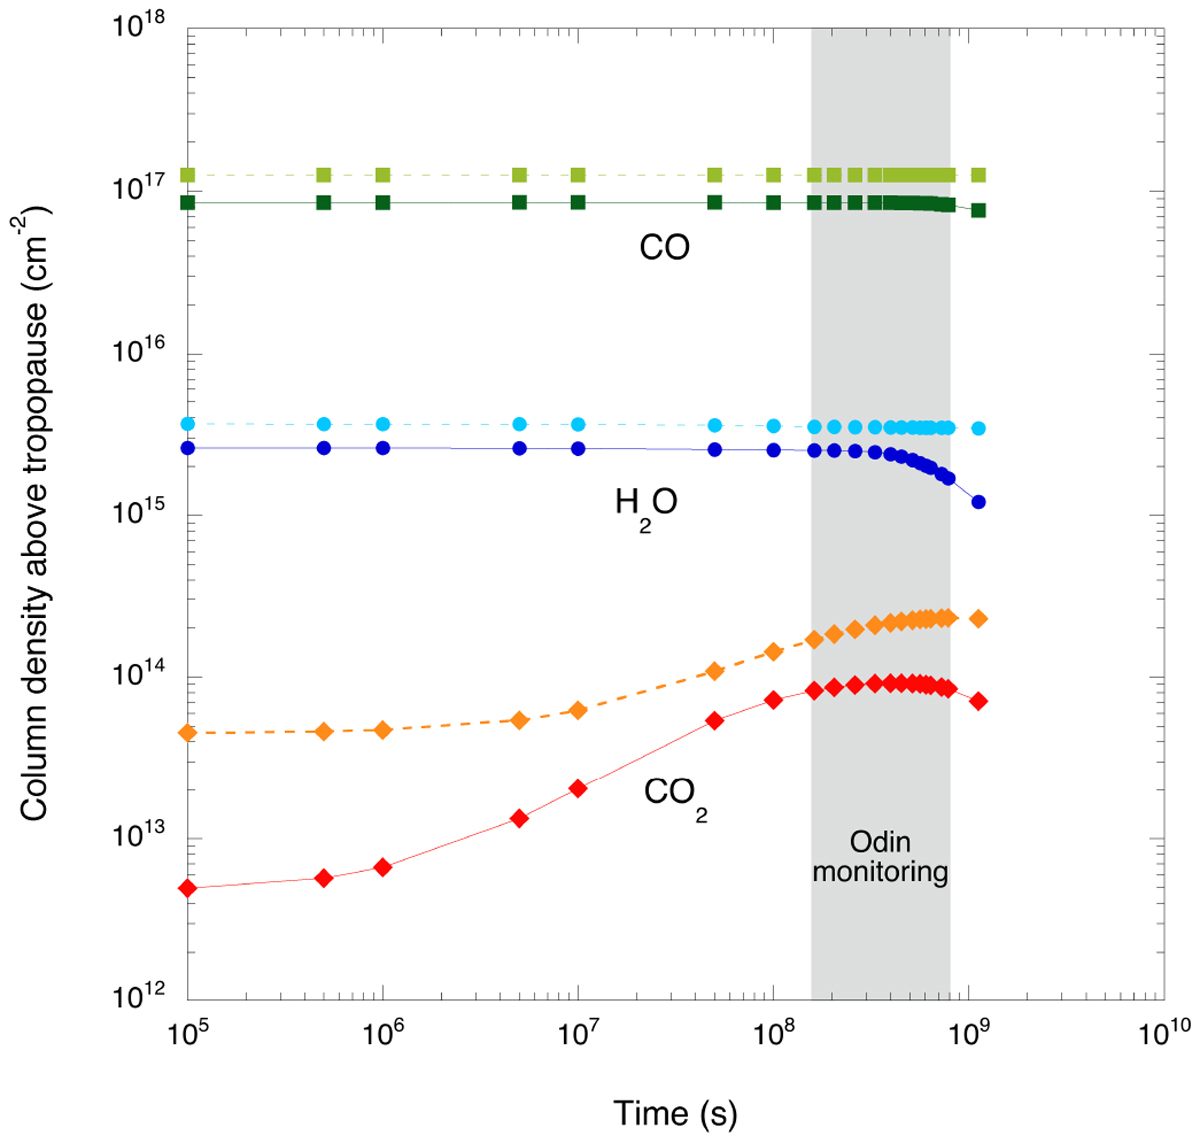
Column densities as a function of time after the SL9 impacts (1994) for CO, H2O, and CO2. Model A results in the light green, cyan, and orange curves, while Model B results in the dark green, dark blue, and red ones. The offset between the two models results from the different background column resulting from the IDP source (see Sect. 3.1.1). The period covering the Odin monitoring (2002-2019) is highlighted in grey.
Current usage metrics show cumulative count of Article Views (full-text article views including HTML views, PDF and ePub downloads, according to the available data) and Abstracts Views on Vision4Press platform.
Data correspond to usage on the plateform after 2015. The current usage metrics is available 48-96 hours after online publication and is updated daily on week days.
Initial download of the metrics may take a while.