Fig. 4
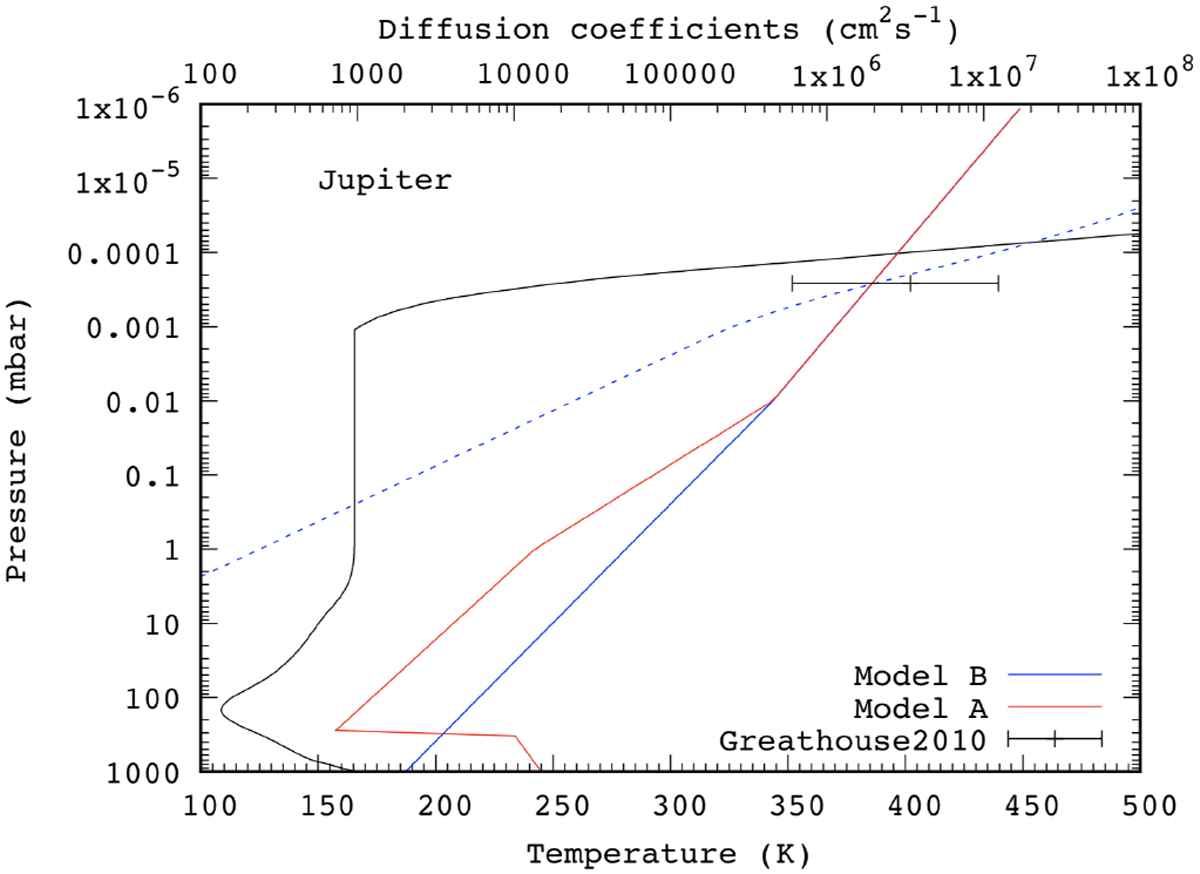
Temperature–pressure profile taken from Hue et al. (2018; black solid line). Eddy diffusion coefficient Kzz profile from Moses et al. (2005; red solid line – Model A) compared to our nominal profile (blue solid line – Model B). The CH4 homopause occurs where the Kzz profile crosses the CH4 molecular diffusion coefficient profile (blue dashed lines). The Kzz value derived by Greathouse et al. (2010) at this level is shown for comparison. Our nominal Kzz is unconstrained from our H2O observationsfor pressures higher than ~5 mbar.
Current usage metrics show cumulative count of Article Views (full-text article views including HTML views, PDF and ePub downloads, according to the available data) and Abstracts Views on Vision4Press platform.
Data correspond to usage on the plateform after 2015. The current usage metrics is available 48-96 hours after online publication and is updated daily on week days.
Initial download of the metrics may take a while.