Fig. 3
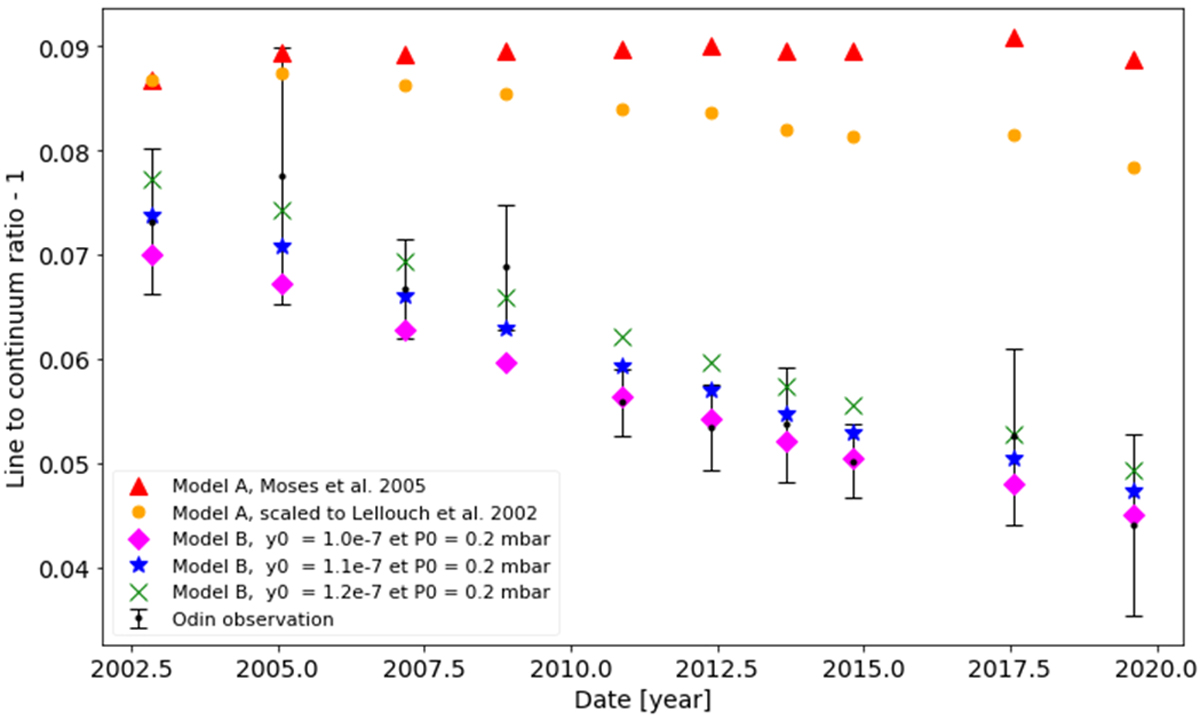
Evolution of the H2O line-to-continuum ratio observed by Odin in the atmosphere of Jupiter (black points). The blue stars represent the results obtained with our Kzz Model B. The green and pink dots correspond to different values of the y0 parameter with the same model. The red triangles stand for our nominal parameters of y0 and p0 and Kzz Model A (profile from Moses et al. 2005). The orange dots depict the results obtained with the vertical profiles of Model A after rescaling their respective column densities to the temporal evolution modeled by Lellouch et al. (2002) with their chemistry-2D transport model.
Current usage metrics show cumulative count of Article Views (full-text article views including HTML views, PDF and ePub downloads, according to the available data) and Abstracts Views on Vision4Press platform.
Data correspond to usage on the plateform after 2015. The current usage metrics is available 48-96 hours after online publication and is updated daily on week days.
Initial download of the metrics may take a while.