Free Access
Fig. 9.
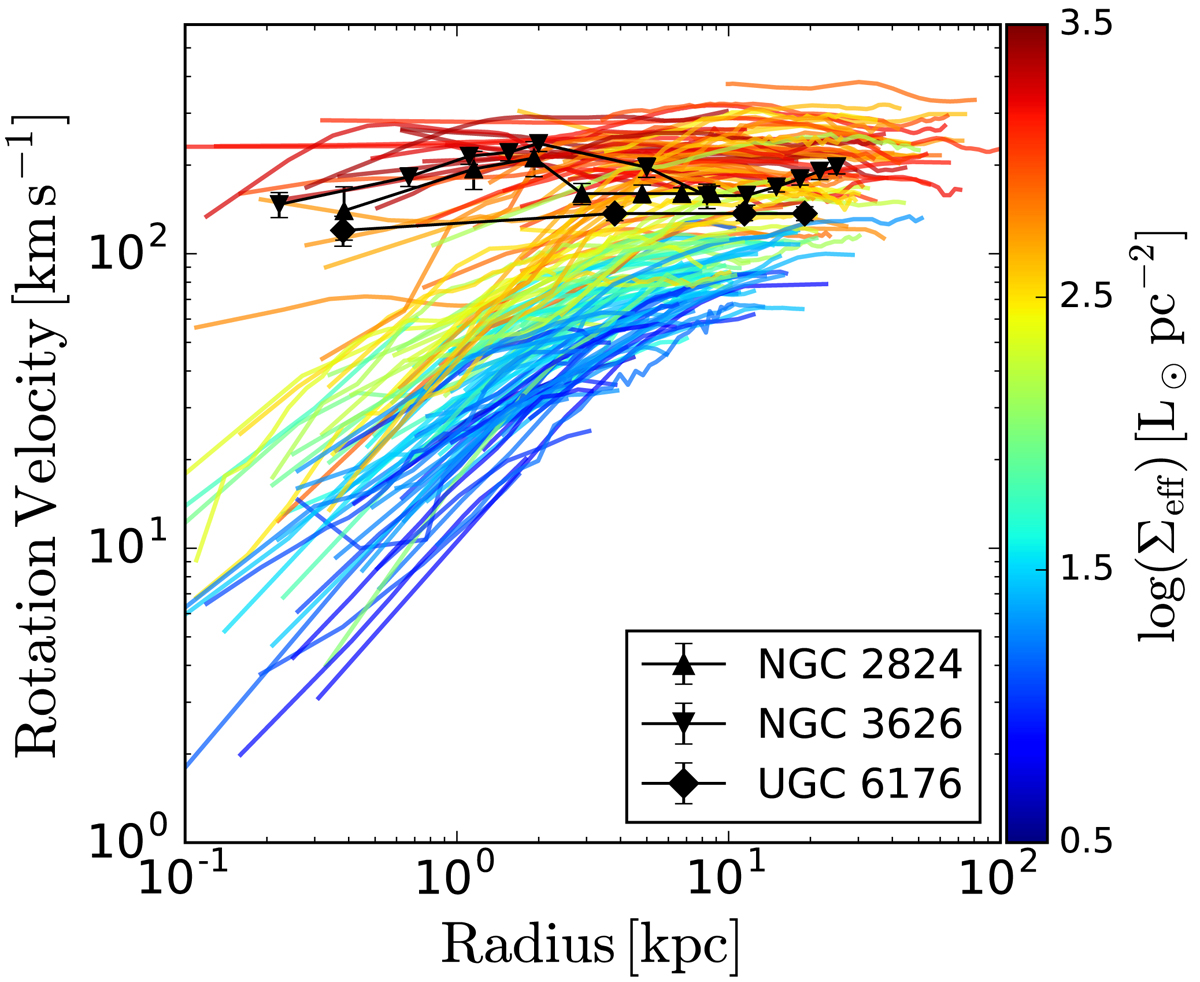
Rotation curves of LTGs from the SPARC sample (Lelli et al. 2016) overlaid with the rotation curves of our ETGs. The LTG rotation curves are color-coded by their effective surface brightness at 3.6 μm. The location of the ETGs is consistent with their high effective surface brightnesses of ∼103 L⊙ pc−2.
Current usage metrics show cumulative count of Article Views (full-text article views including HTML views, PDF and ePub downloads, according to the available data) and Abstracts Views on Vision4Press platform.
Data correspond to usage on the plateform after 2015. The current usage metrics is available 48-96 hours after online publication and is updated daily on week days.
Initial download of the metrics may take a while.