Fig. 7.
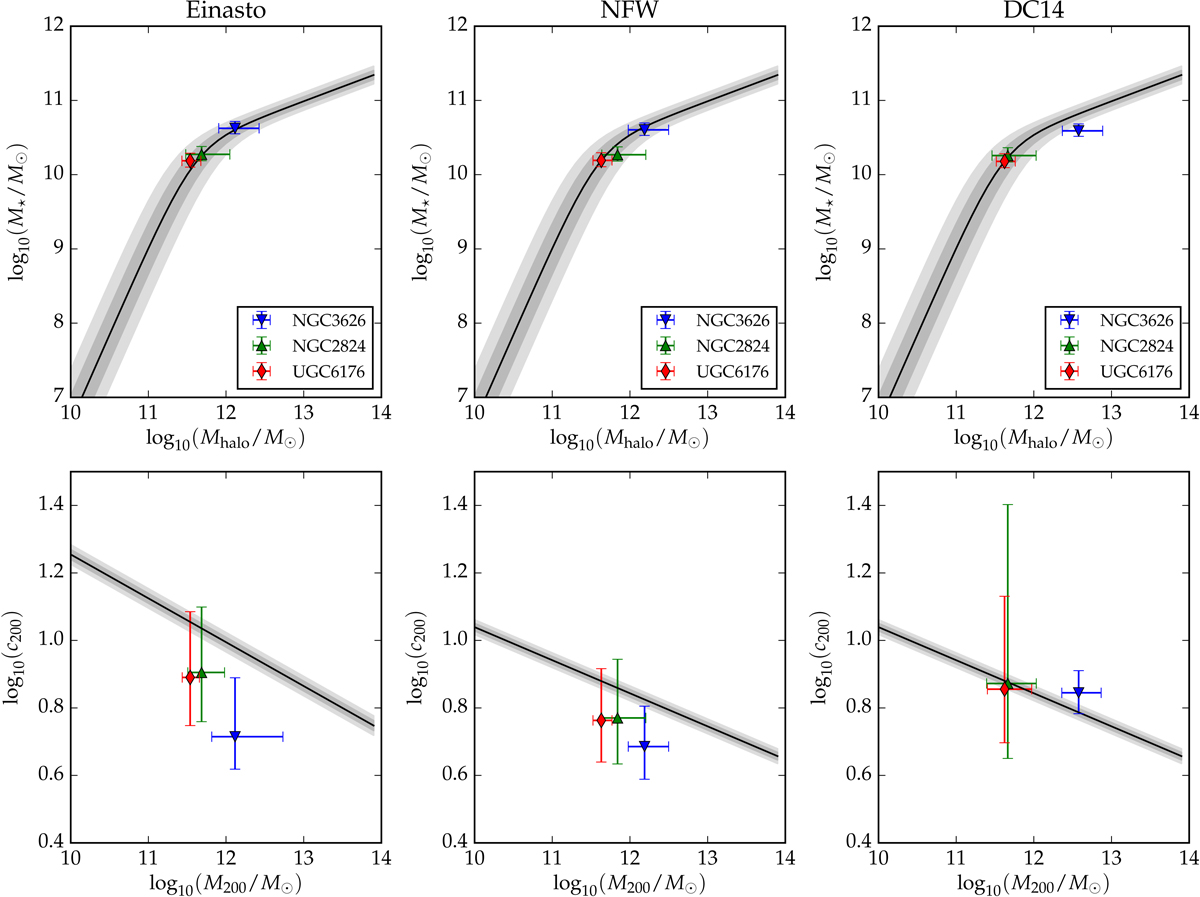
Stellar-to-halo-mass relation (top) and halo mass-concentration relation (bottom). The black solid line and the gray shaded areas show the relations expected in ΛCDM together with their intrinsic scatter (Moster et al. 2013; Dutton & Macciò 2014). The solid points with ±1 sigma errorbars show the maximum-probability values from rotation-curve fits with ΛCDM priors.
Current usage metrics show cumulative count of Article Views (full-text article views including HTML views, PDF and ePub downloads, according to the available data) and Abstracts Views on Vision4Press platform.
Data correspond to usage on the plateform after 2015. The current usage metrics is available 48-96 hours after online publication and is updated daily on week days.
Initial download of the metrics may take a while.