Fig. 4.
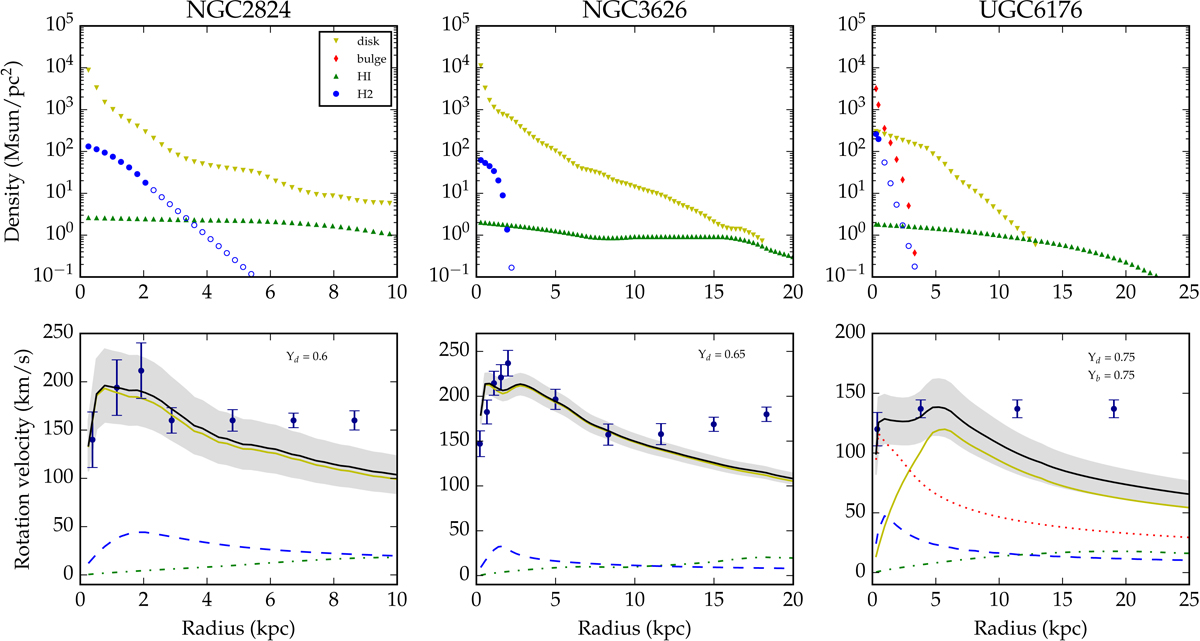
Top panels: surface density profiles for the H2 disk (blue circles), HI disk (green upward triangles), stellar disk (yellow downward triangles), and stellar bulge (red diamonds) when necessary. Open circles indicate that the surface density is extrapolated from an exponential fit. Bottom panels: observed rotation curve (dots with ±1σ error bars) is fit with a maximum-disk mass models (black solid line with ±1σ error band). The baryonic rotation curve is decomposed into the contributions of molecular gas (blue dashed line), atomic gas (green dash-dotted line), stellar disk (yellow solid line), and stellar bulge (red dotted line) when necessary. The maximum mass-to-light ratios are given in the top right corner.
Current usage metrics show cumulative count of Article Views (full-text article views including HTML views, PDF and ePub downloads, according to the available data) and Abstracts Views on Vision4Press platform.
Data correspond to usage on the plateform after 2015. The current usage metrics is available 48-96 hours after online publication and is updated daily on week days.
Initial download of the metrics may take a while.