Free Access
Fig. 2.
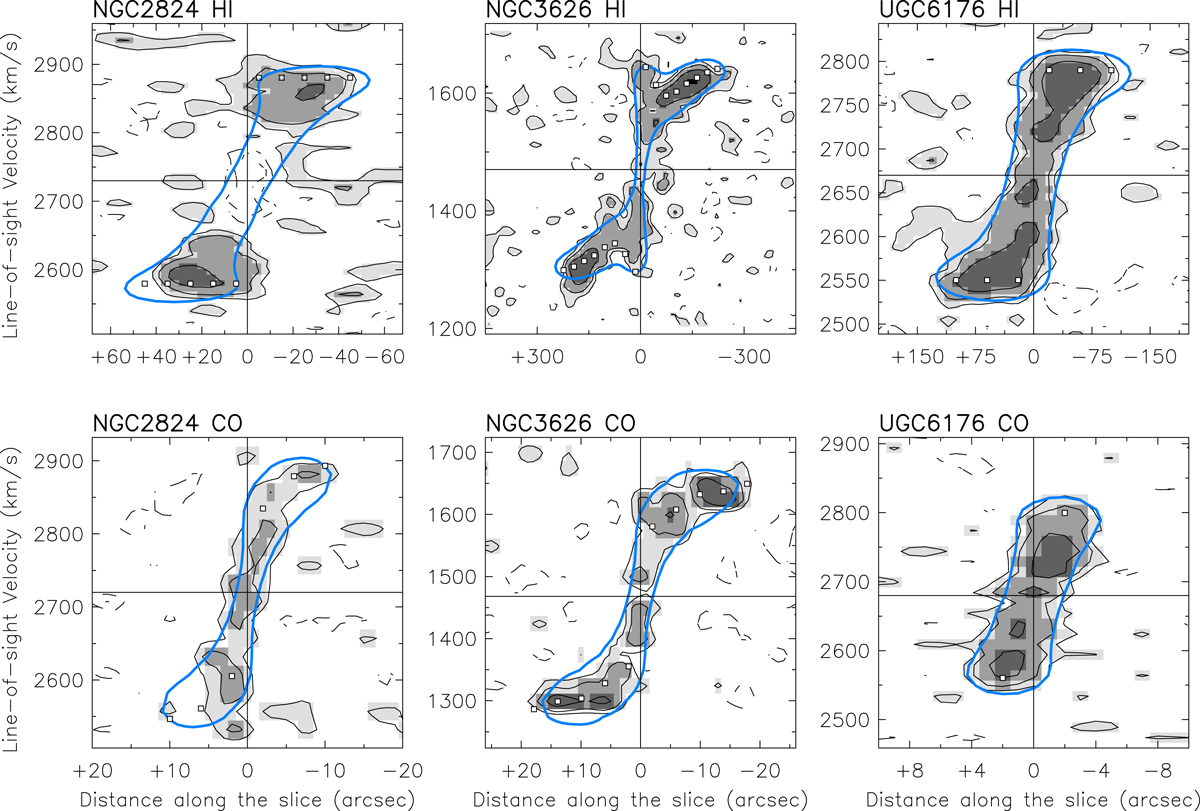
Major-axis PV diagrams from the observed HI cube (top row) and the CO one (bottom row), overlaid with the projected rotation curve (white squares) and model PV diagrams (blue contour corresponding to 1.5σ from Table 2).
Current usage metrics show cumulative count of Article Views (full-text article views including HTML views, PDF and ePub downloads, according to the available data) and Abstracts Views on Vision4Press platform.
Data correspond to usage on the plateform after 2015. The current usage metrics is available 48-96 hours after online publication and is updated daily on week days.
Initial download of the metrics may take a while.