Fig. A.2.
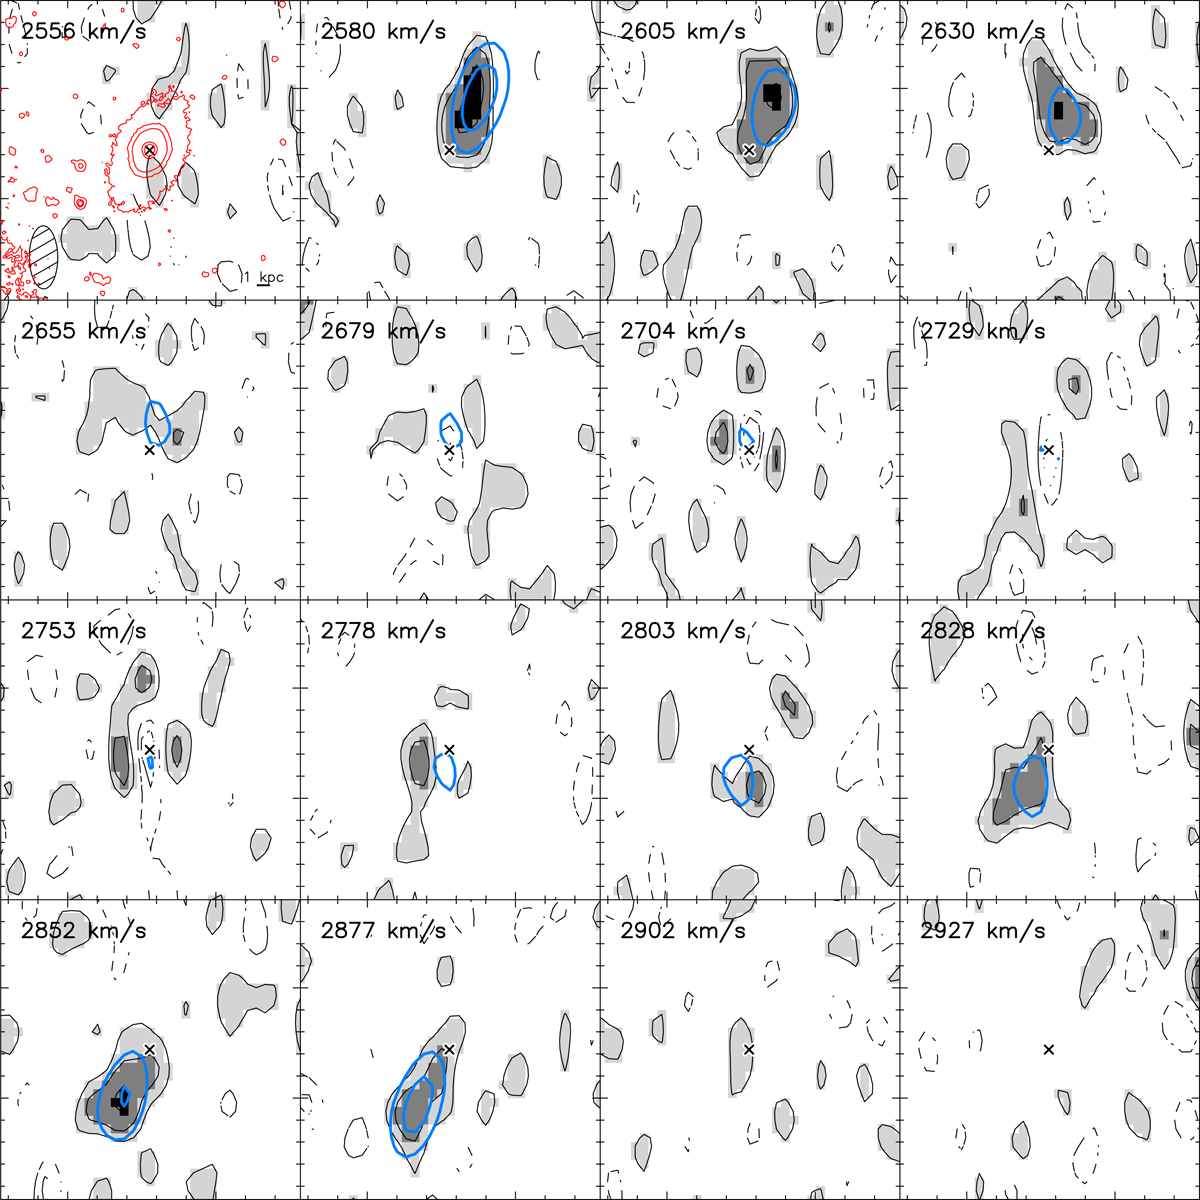
HI channel maps for NGC 2824 from the observed cube (gray scale) and the model cube (blue contours). The line-of-sight velocity is shown in the upper left corner. The cross indicates the galaxy center. The contours correspond to −3σ, −1.5σ (dashed) and 1.5σ, 3σ, 6σ, and so on (solid). In the first panel, the red contours correspond to arbitrary isophotes of the Spitzer image at 3.6 μm, the beam is shown in the bottom-left corner, and the physical scale is given in the bottom-right corner.
Current usage metrics show cumulative count of Article Views (full-text article views including HTML views, PDF and ePub downloads, according to the available data) and Abstracts Views on Vision4Press platform.
Data correspond to usage on the plateform after 2015. The current usage metrics is available 48-96 hours after online publication and is updated daily on week days.
Initial download of the metrics may take a while.