Fig. A.1.
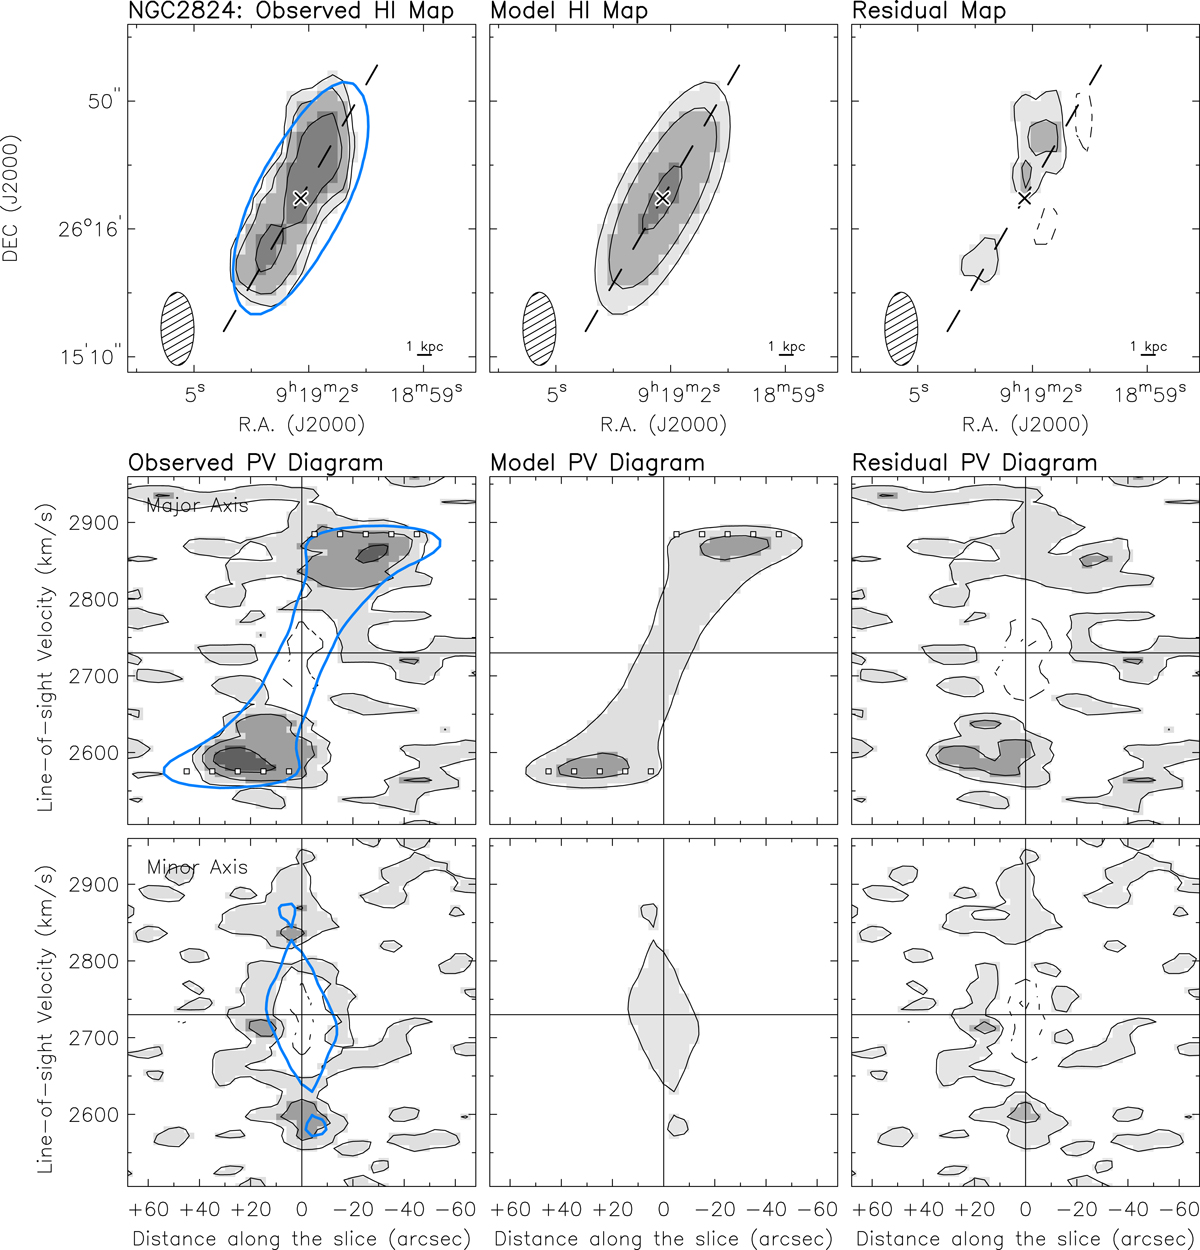
Top panels: HI intensity maps from the observed cube (left), model cube (middle) and residual cube (right) of NGC 2824. The cross and the dashed line indicate the galaxy center and position angle, respectively. The beam is shown in the bottom left corner. The physical scale is illustrated in the bottom right corner. The contours correspond to 3σpseudo, 6σpseudo, and so on. The outermost contour of the model is plotted in blue over the observed intensity map for comparison. Bottom panels: position-velocity diagrams taken along the major and minor axes from the observed cube (left), model cube (middle) and residual cube (right). The white squares show our derived rotation curve. The outermost contour of the model is plotted in blue over the observed PV diagrams for comparison. The density contours in the PV diagrams correspond to −1.5σ, −3σ (dashed) and 1.5σ, 3σ, 6σ, and so on (solid), where σ is the measured noise in the cube (see Table 2).
Current usage metrics show cumulative count of Article Views (full-text article views including HTML views, PDF and ePub downloads, according to the available data) and Abstracts Views on Vision4Press platform.
Data correspond to usage on the plateform after 2015. The current usage metrics is available 48-96 hours after online publication and is updated daily on week days.
Initial download of the metrics may take a while.