Fig. 1.
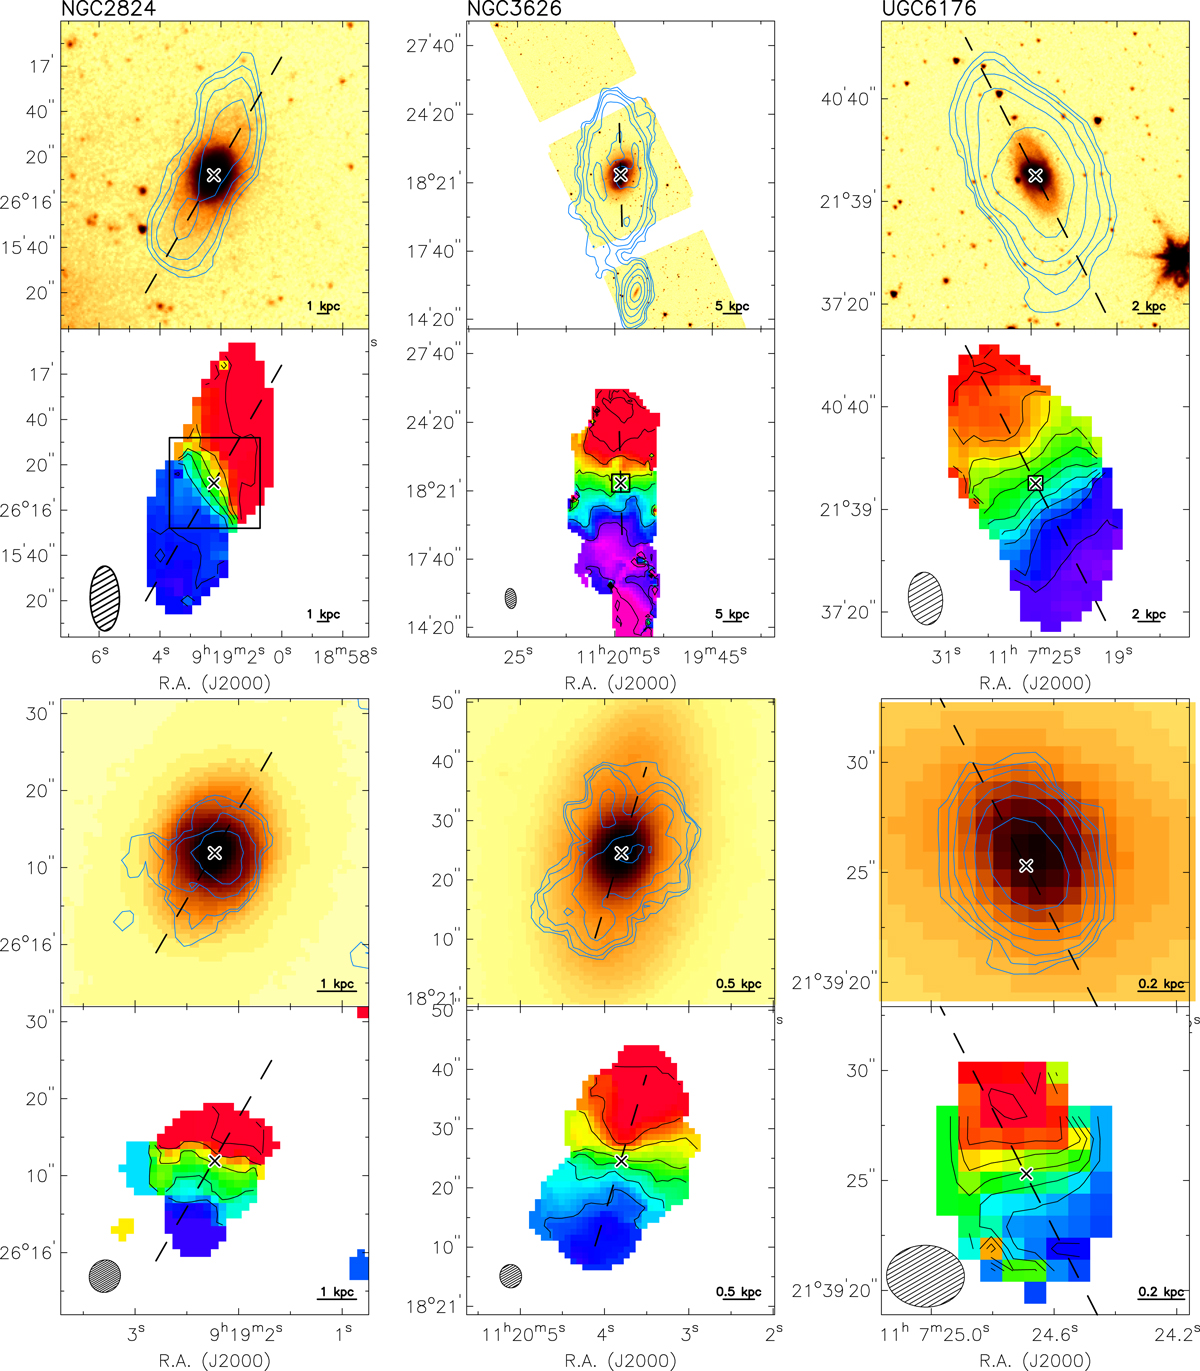
Moment maps for NGC 2824 (left), NGC 3626 (middle), and UGC 6176 (right). The top section shows the HI data, while the bottom section shows the CO data. In each section, the top row shows the Spitzer image at 3.6 μm overlaid with the gas intensity maps, while the bottom row shows the velocity field. The box in the HI velocity field depicts the size of the CO frame. The cross corresponds to the galaxy center; the dashed line indicates the kinematic major axis; the physical scale is illustrated in the bottom-right corner; the beam shape is shown in the bottom-left corner. The HI and CO density contours are multiples of the pseudo-3σ value (0.5, 1, 2, 4, ...) where 3σmap is given in Table 2.
Current usage metrics show cumulative count of Article Views (full-text article views including HTML views, PDF and ePub downloads, according to the available data) and Abstracts Views on Vision4Press platform.
Data correspond to usage on the plateform after 2015. The current usage metrics is available 48-96 hours after online publication and is updated daily on week days.
Initial download of the metrics may take a while.