Fig. 7.
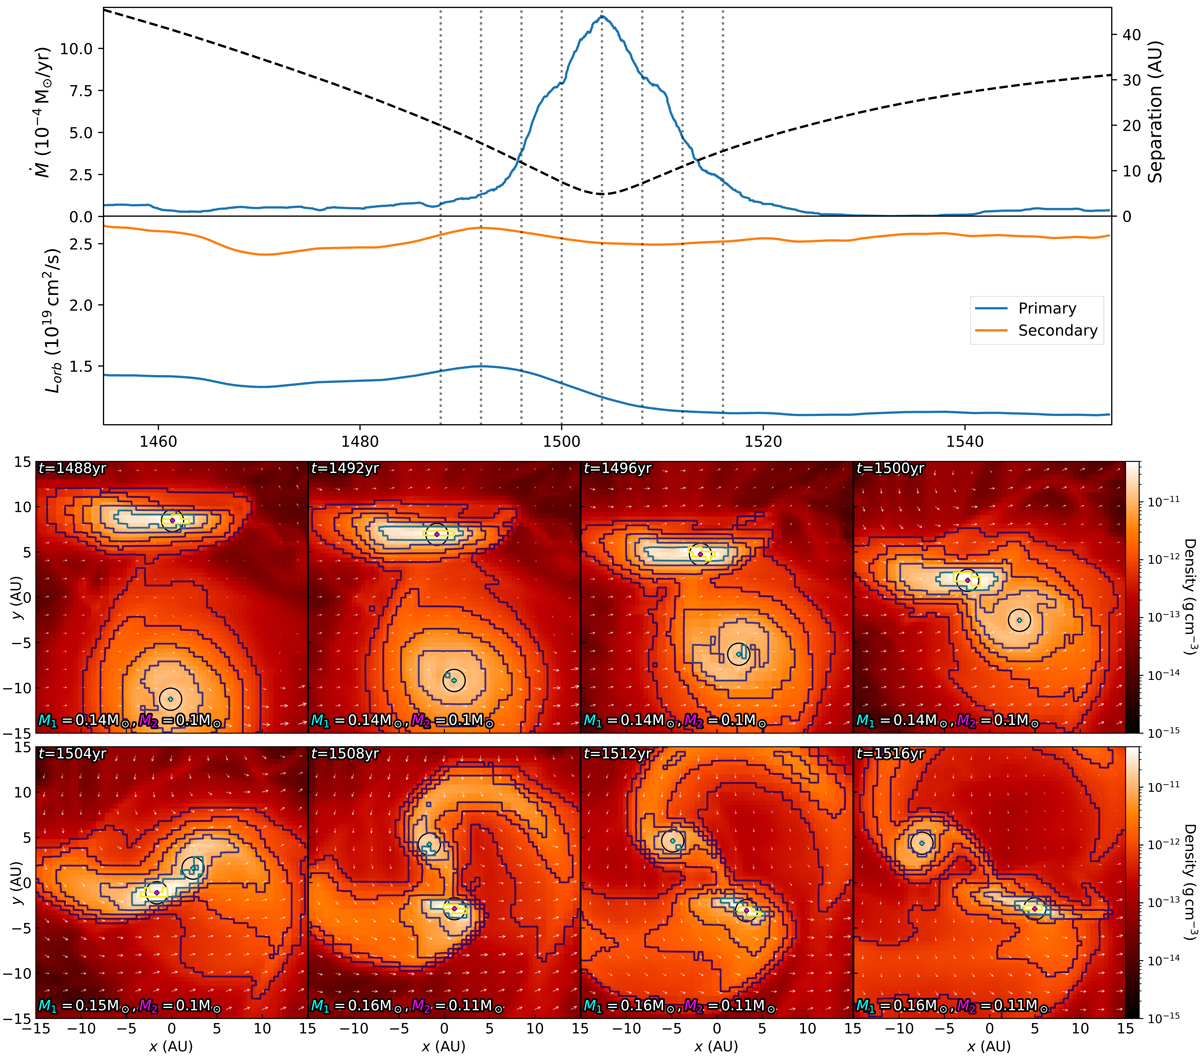
Top: accretion and specific orbital angular momentum profiles of the accretion burst at the first periastron passage. The profile is smoothed by taking a moving average over a window of 10 yr. The dashed line in the top panel shows the separation of the binary. In the bottom panel the momentum is plotted for the primary and secondary star. The vertical dotted lines indicate the times when density slices were taken, which are shown in the bottom figure. Bottom: zoomed-in slices of the high-resolution simulation of the T2 scenario with Lref = 14. The slices are produced with the same methods as Figs. 1 and 2 but with a projection thickness of 30 AU. The black circles show the accretion radius of the stars. The solid lines are density contours spaced evenly in log-space at density =[0.5, 1.3, 3.2, 7.9, 20, 50]×10−12 g cm−3.
Current usage metrics show cumulative count of Article Views (full-text article views including HTML views, PDF and ePub downloads, according to the available data) and Abstracts Views on Vision4Press platform.
Data correspond to usage on the plateform after 2015. The current usage metrics is available 48-96 hours after online publication and is updated daily on week days.
Initial download of the metrics may take a while.