Fig. 4.
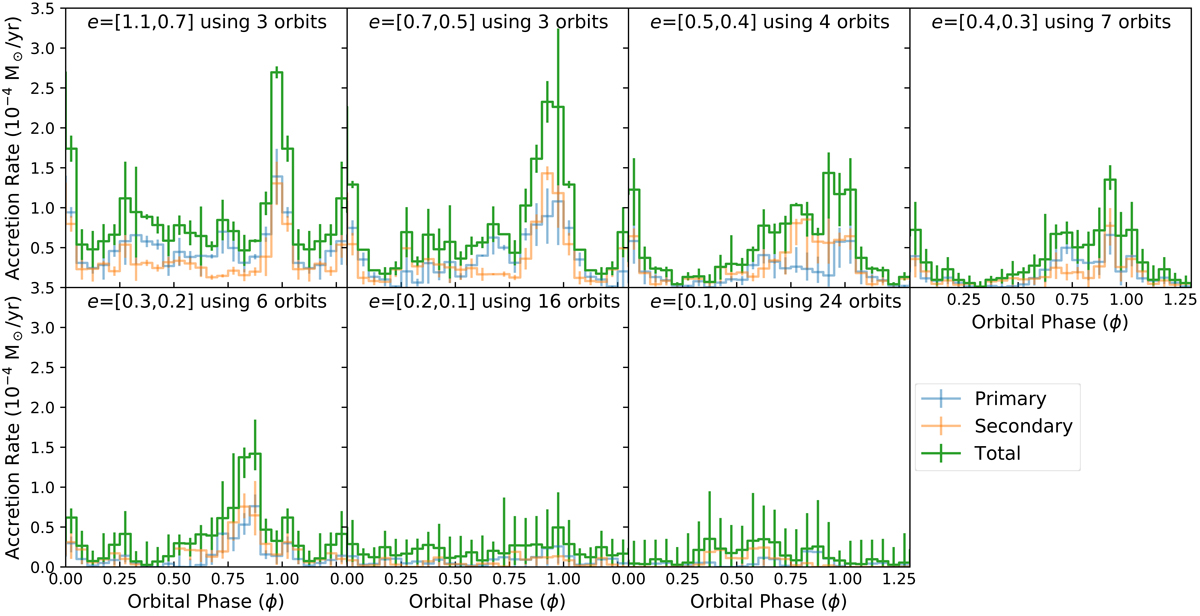
Phase-folded accretion within the defined eccentricity bins (see Table 1) for T1. The transparent blue and orange lines are the median accretion rate for the primary and secondary components of the binary, respectively. The solid green line is the total accretion rate. The error for each bin is taken to be the 16th and 84th percentile.
Current usage metrics show cumulative count of Article Views (full-text article views including HTML views, PDF and ePub downloads, according to the available data) and Abstracts Views on Vision4Press platform.
Data correspond to usage on the plateform after 2015. The current usage metrics is available 48-96 hours after online publication and is updated daily on week days.
Initial download of the metrics may take a while.