Fig. 1.
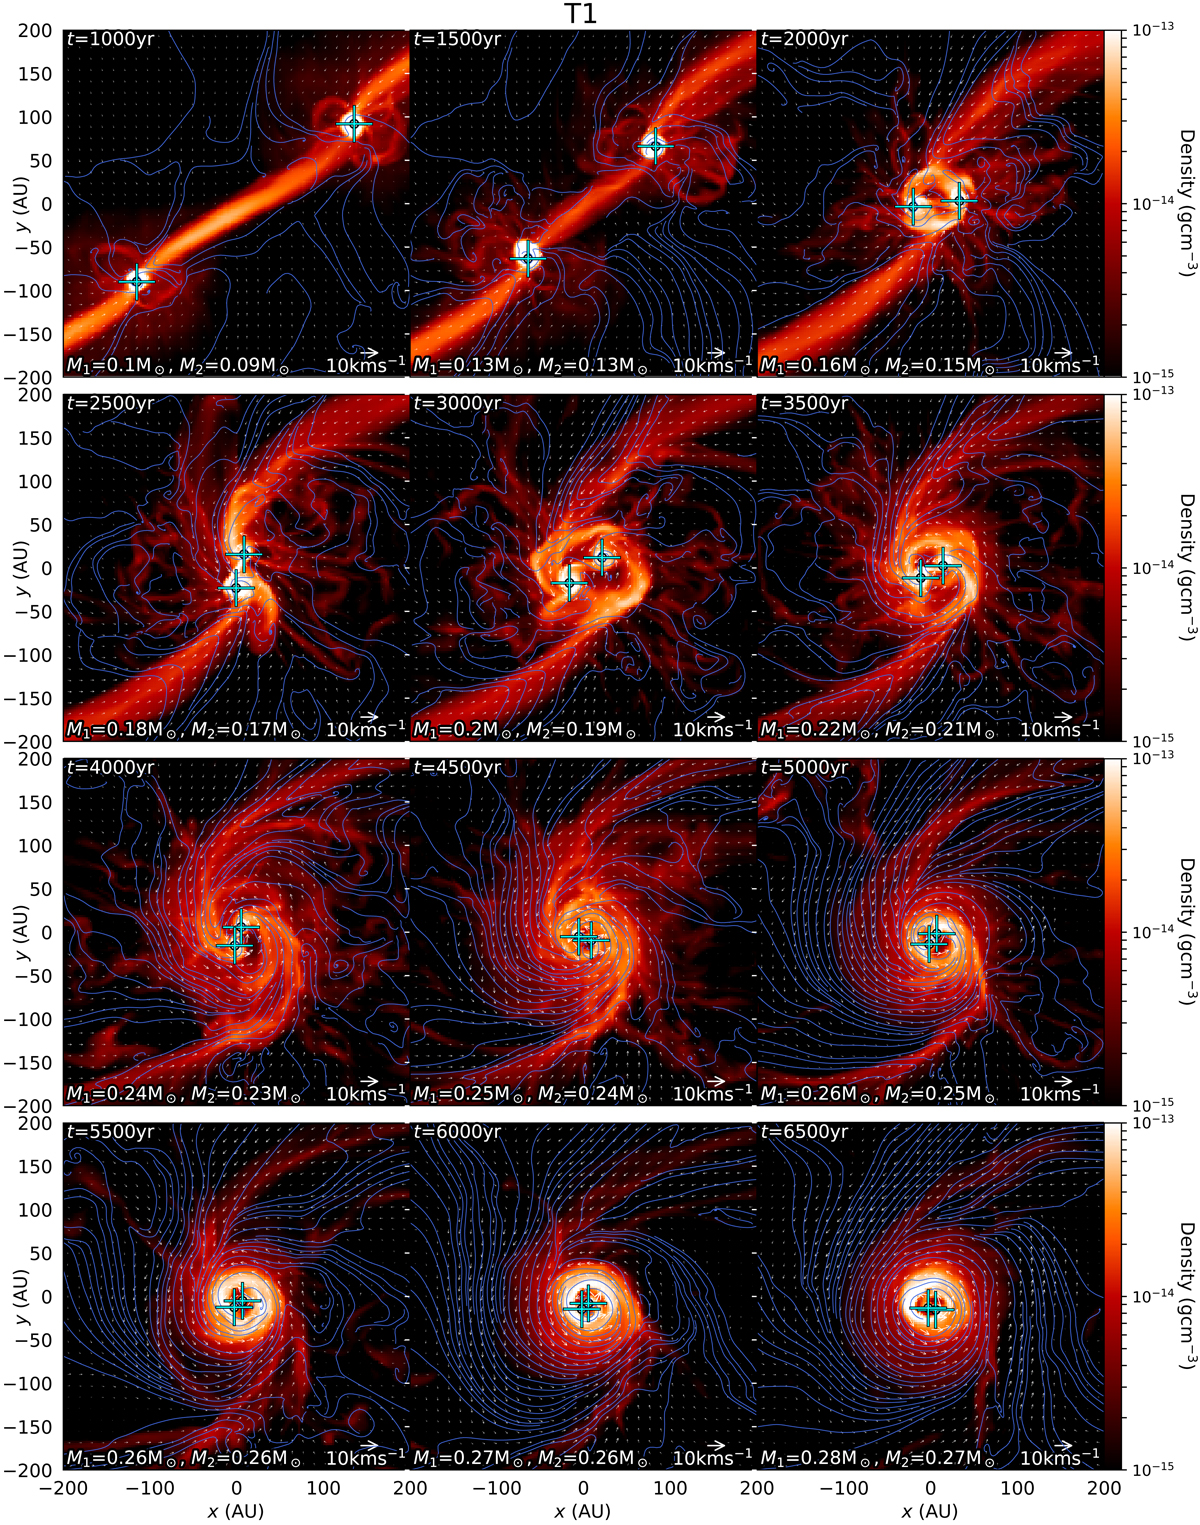
300 AU thick volume-weighted slices through the gas density orientated along the z = 0 plane (perpendicular to the rotation axis of the core) for T1. Each panel progresses at 500 yr intervals since 1000 yr after the first protostar formation. The thin lines show the magnetic field, and the arrows indicate the velocity field. Crosses show the position of the sink particles. The mass accreted by the sink particles in the simulations is indicated on the bottom left of each panel. The circles around the centre of the crosses indicate the sink particle accretion rate.
Current usage metrics show cumulative count of Article Views (full-text article views including HTML views, PDF and ePub downloads, according to the available data) and Abstracts Views on Vision4Press platform.
Data correspond to usage on the plateform after 2015. The current usage metrics is available 48-96 hours after online publication and is updated daily on week days.
Initial download of the metrics may take a while.