Fig. 7
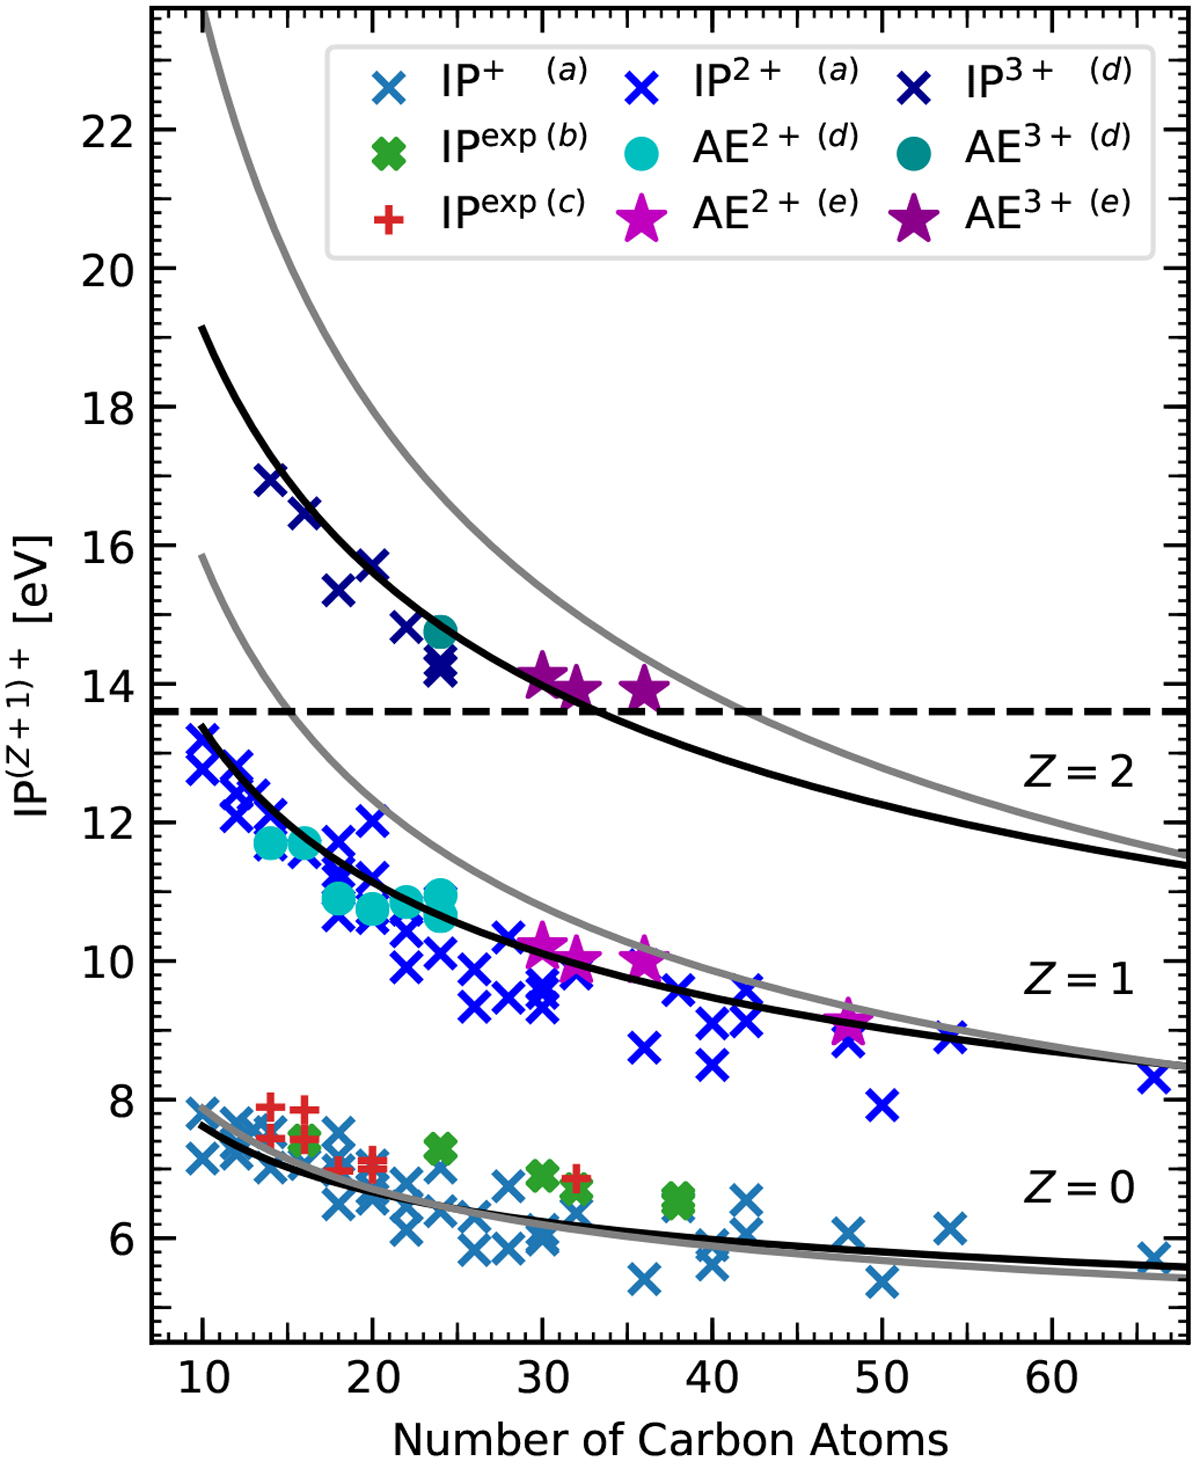
Theoretically calculated ionization potentials, IP(Z+1)+, experimentally obtained IPexp and appearance energies, AE(Z+1)+, as a functionof the number of carbon atoms. For Z = 0, 1, 2, the values refer to the transition ![]() . The black and gray curves are the modeled IP
. The black and gray curves are the modeled IP![]() from Weingartner & Draine (2001b) and IP
from Weingartner & Draine (2001b) and IP![]() from Bakes & Tielens (1994b), respectively, as an estimate of the IP(Z+1)+
evolution as a function of PAH size and charge, Z
(see Eqs. (1) and (3) and text for details). The dashed horizontal line marks the
13.6 eV photon energy cut-off for H I regions. Notes: (a) taken from Malloci et al. (2007b); (b) taken from Clar et al. (1981); (c) taken from Hager & Wallace (1988); (d) taken from Zhen et al. (2016); (e) this work.
from Bakes & Tielens (1994b), respectively, as an estimate of the IP(Z+1)+
evolution as a function of PAH size and charge, Z
(see Eqs. (1) and (3) and text for details). The dashed horizontal line marks the
13.6 eV photon energy cut-off for H I regions. Notes: (a) taken from Malloci et al. (2007b); (b) taken from Clar et al. (1981); (c) taken from Hager & Wallace (1988); (d) taken from Zhen et al. (2016); (e) this work.
Current usage metrics show cumulative count of Article Views (full-text article views including HTML views, PDF and ePub downloads, according to the available data) and Abstracts Views on Vision4Press platform.
Data correspond to usage on the plateform after 2015. The current usage metrics is available 48-96 hours after online publication and is updated daily on week days.
Initial download of the metrics may take a while.