Fig. 8.
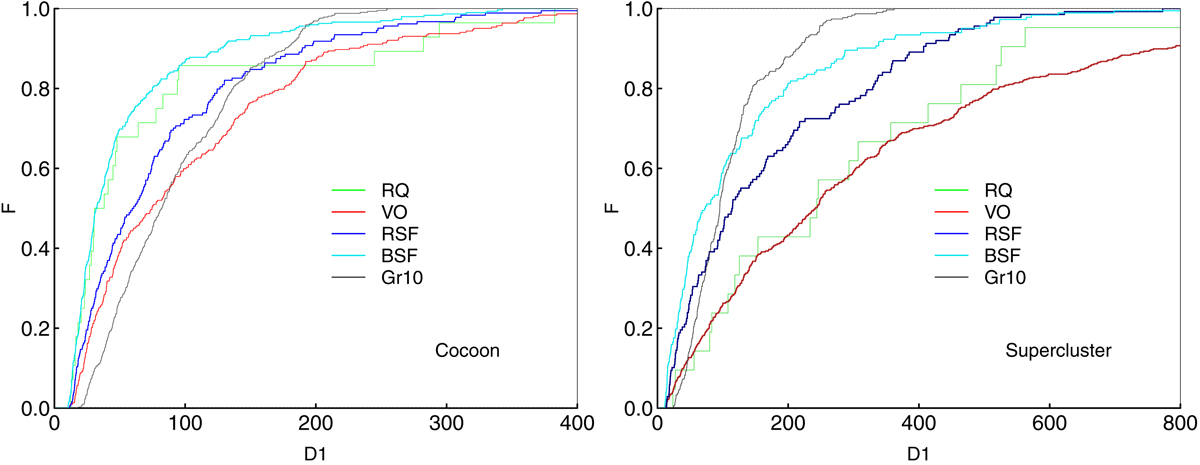
Cumulative distributions of the local luminosity-density field values D1 around BSF galaxies (turquoise line), RSF galaxies (blue line), RQ galaxies (green line), and VO galaxies (red line) in the supercluster (right panel) and in the cocoon (left panel). Grey line shows D1 distributions for poor groups with Ngal ≤ 10. Note the different D1 range in the cocoon (left panel, 0 ≤ D1 ≤ 400), and in the supercluster (right panel, D1 spans from 0 to 800).
Current usage metrics show cumulative count of Article Views (full-text article views including HTML views, PDF and ePub downloads, according to the available data) and Abstracts Views on Vision4Press platform.
Data correspond to usage on the plateform after 2015. The current usage metrics is available 48-96 hours after online publication and is updated daily on week days.
Initial download of the metrics may take a while.