Fig. 5.
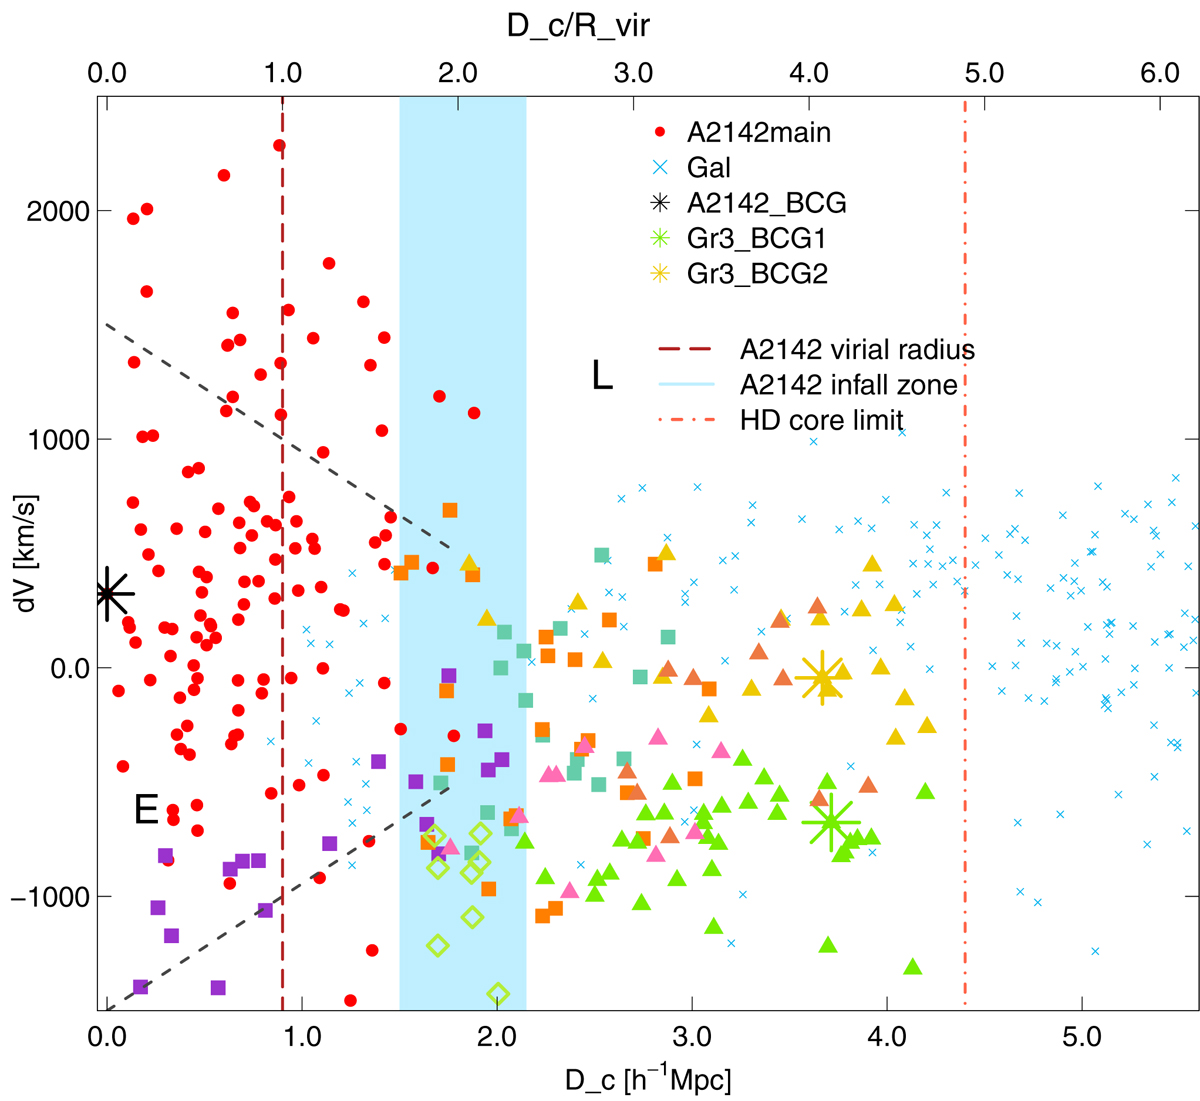
Velocity of galaxies with respect to the cluster mean velocity vs. projected distance from the centre of the A2142 cluster (Dc) in the highest density core of the supercluster up to clustercentric distances Dc ≤ 5.2 h−1 Mpc (PPS diagram, this distance range covers the entire high density core of the supercluster, seen in Fig. 4). Lines which separate early and late infall regions are calculated using radius 1.8 h−1 Mpc (Einasto et al. 2018b). Notations are as in Fig. 4. Blue polygon marks infall zone of the cluster A2142, dark red dashed line denotes the virial radius of the cluster, and light red dot-dashed line denotes the boundaries of the HDC of the supercluster.
Current usage metrics show cumulative count of Article Views (full-text article views including HTML views, PDF and ePub downloads, according to the available data) and Abstracts Views on Vision4Press platform.
Data correspond to usage on the plateform after 2015. The current usage metrics is available 48-96 hours after online publication and is updated daily on week days.
Initial download of the metrics may take a while.