Fig. 4.
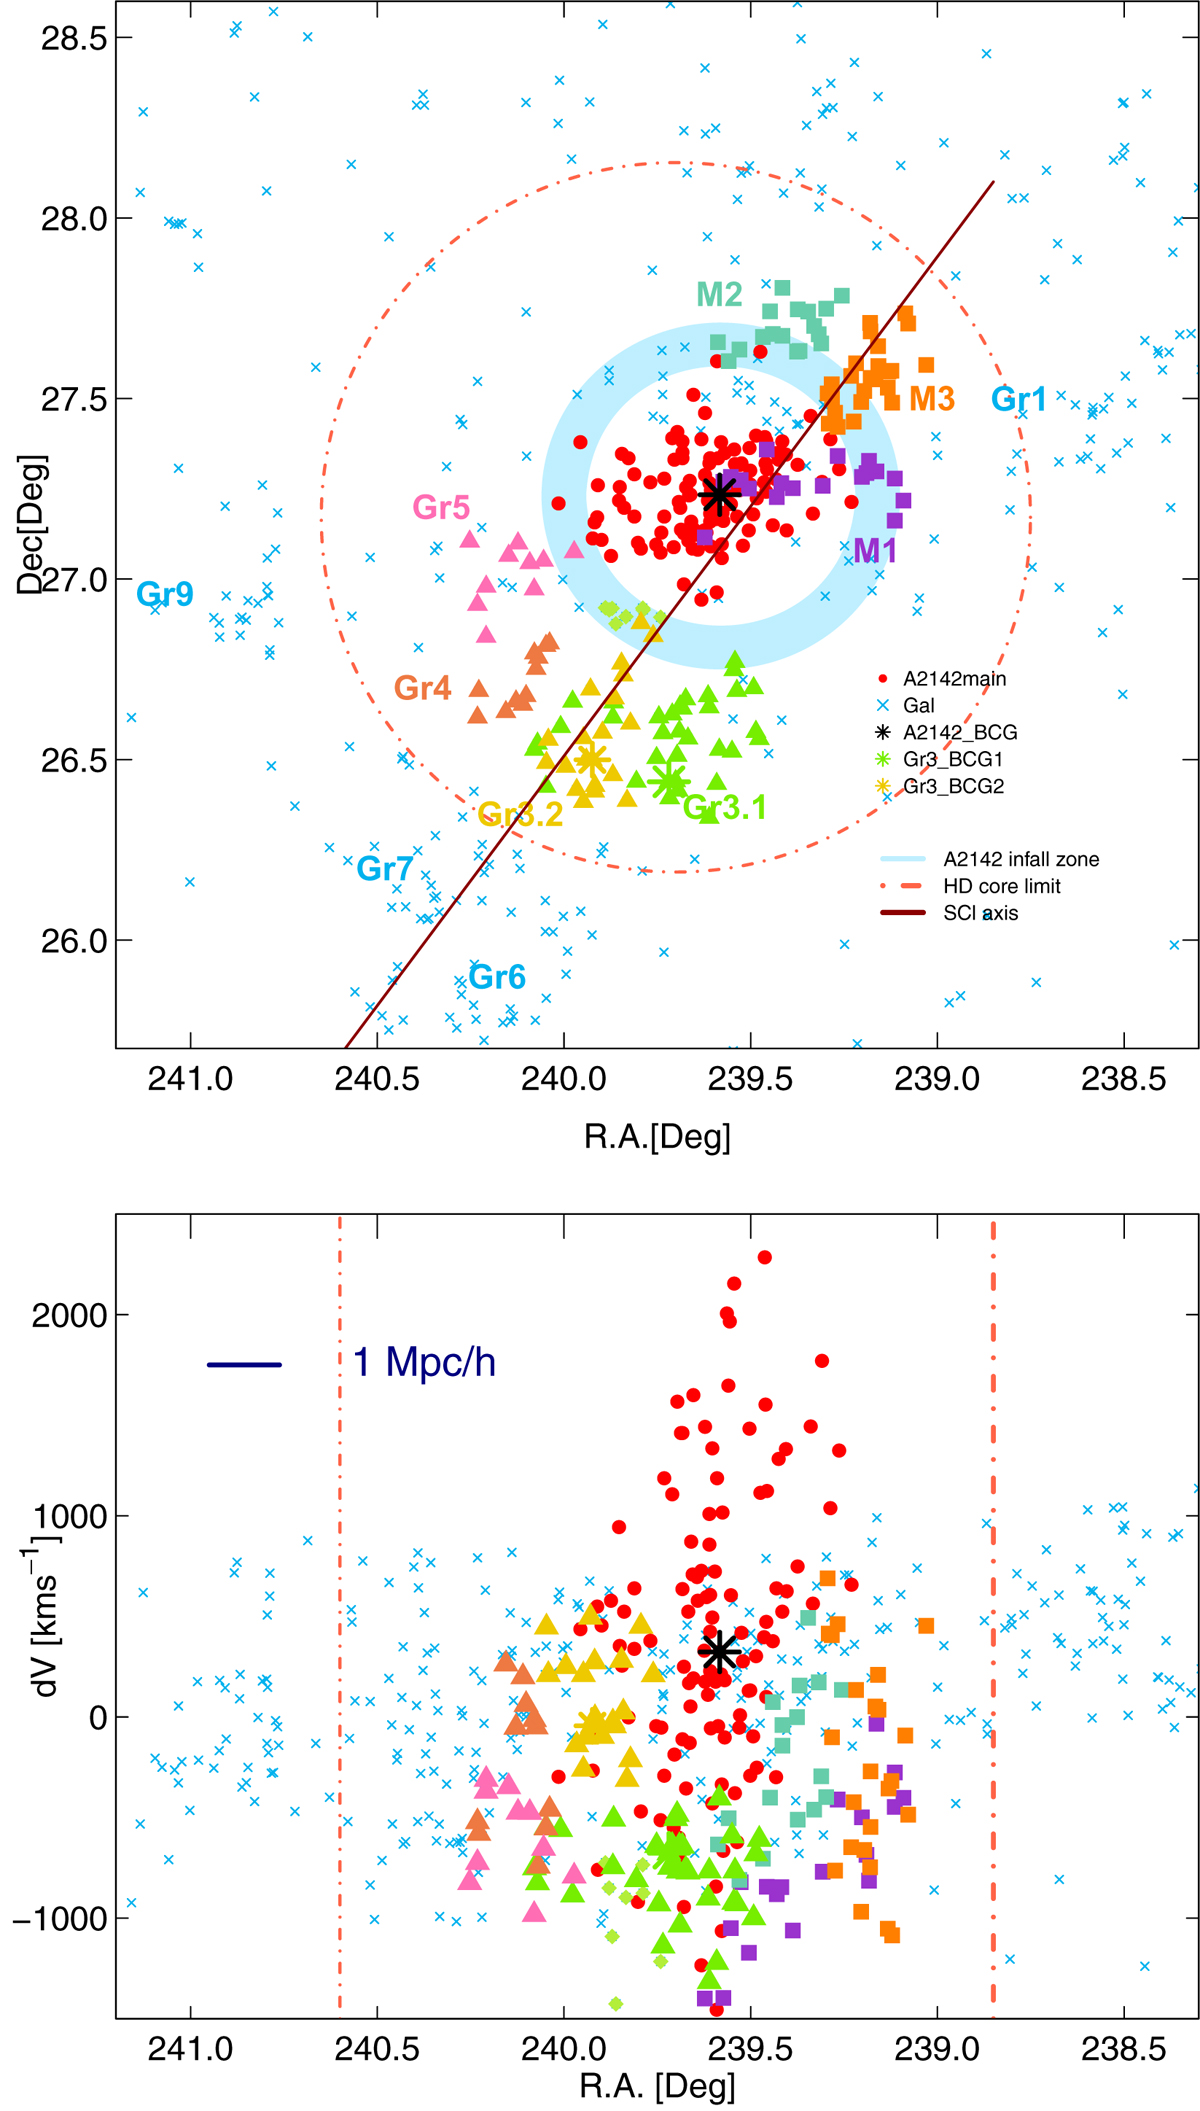
Distribution of galaxies of the supercluster SCl A2142 HDC in the sky plane (upper panel), and in the RA – velocity difference plane (lower panel). The red symbols show galaxies with old stellar populations (Dn(4000) ≥ 1.55), and the blue symbols denote galaxies with young stellar populations (Dn(4000) < 1.55). Red filled circles correspond to galaxies in the main component of the cluster A2142. Blue crosses show other galaxies in the HDC. Filled squares show galaxies in infalling subclusters M1–M3 (violet – M1, pale green – M2, and orange – M3), and filled triangles denote galaxies in HDC groups Gr3–Gr5 (Table 2; violet triangles – Gr5, orange triangles – Gr4, green and yellow triangles denote two components of Gr3, as explained in the text). Lines show HDC boundaries and the direction of the supercluster axis, and the blue circle marks the infall zone of the cluster A2142.
Current usage metrics show cumulative count of Article Views (full-text article views including HTML views, PDF and ePub downloads, according to the available data) and Abstracts Views on Vision4Press platform.
Data correspond to usage on the plateform after 2015. The current usage metrics is available 48-96 hours after online publication and is updated daily on week days.
Initial download of the metrics may take a while.