Fig. 3.
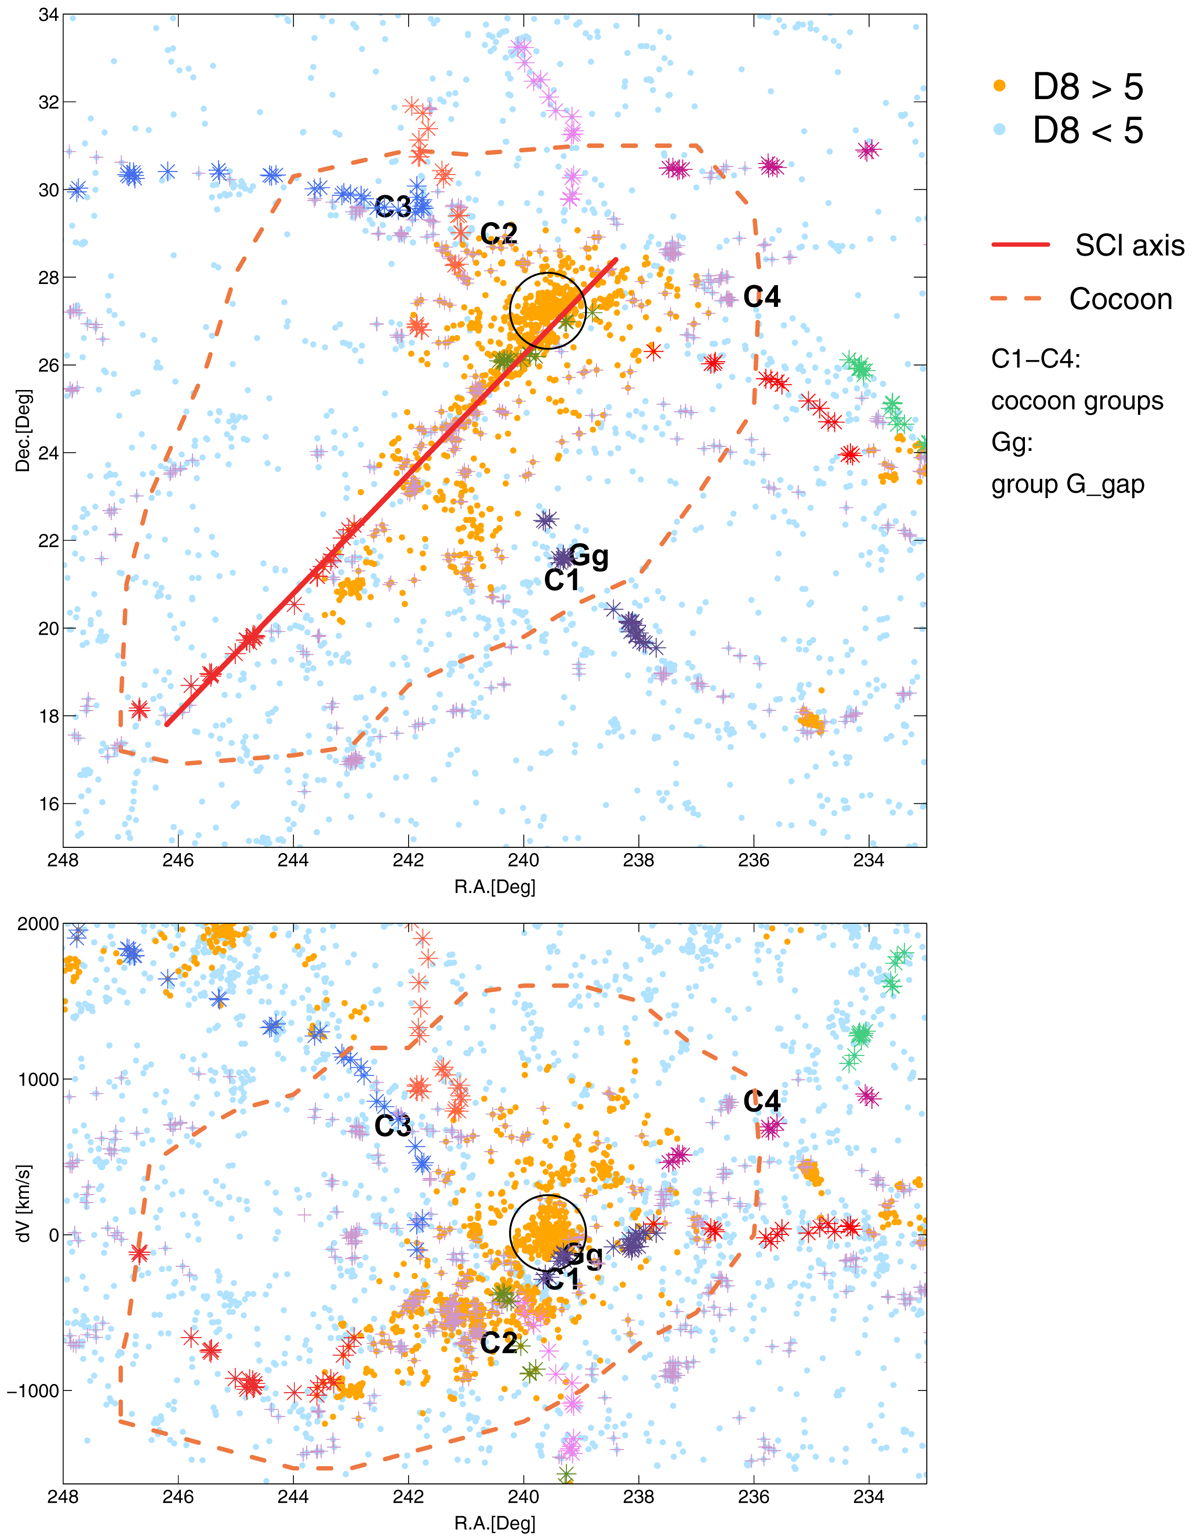
Distribution of galaxies, groups, and filaments around the supercluster SCl A2142 in the sky plane (upper panel) and in the RA – velocity difference plane (lower panel). Orange dots denote galaxies in the supercluster (D8 > 5) and light blue dots mark galaxies in low global density region (D8 < 5). Member galaxies of individual filaments with length ≥20 h−1 Mpc are denoted with stars of different colours and galaxies in filaments shorter than 20 h−1 Mpc with pale violet crosses. Dark red line shows supercluster axis and filament F1033 at its extension. Numbers show ID numbers of groups with at least ten member galaxies in the cocoon (C1-C4, Table 2), and group Ggap is denoted as Gg (see text). Orange dashed line shows the cocoon boundaries, and black circle shows the HDC boundaries.
Current usage metrics show cumulative count of Article Views (full-text article views including HTML views, PDF and ePub downloads, according to the available data) and Abstracts Views on Vision4Press platform.
Data correspond to usage on the plateform after 2015. The current usage metrics is available 48-96 hours after online publication and is updated daily on week days.
Initial download of the metrics may take a while.