Fig. 2.
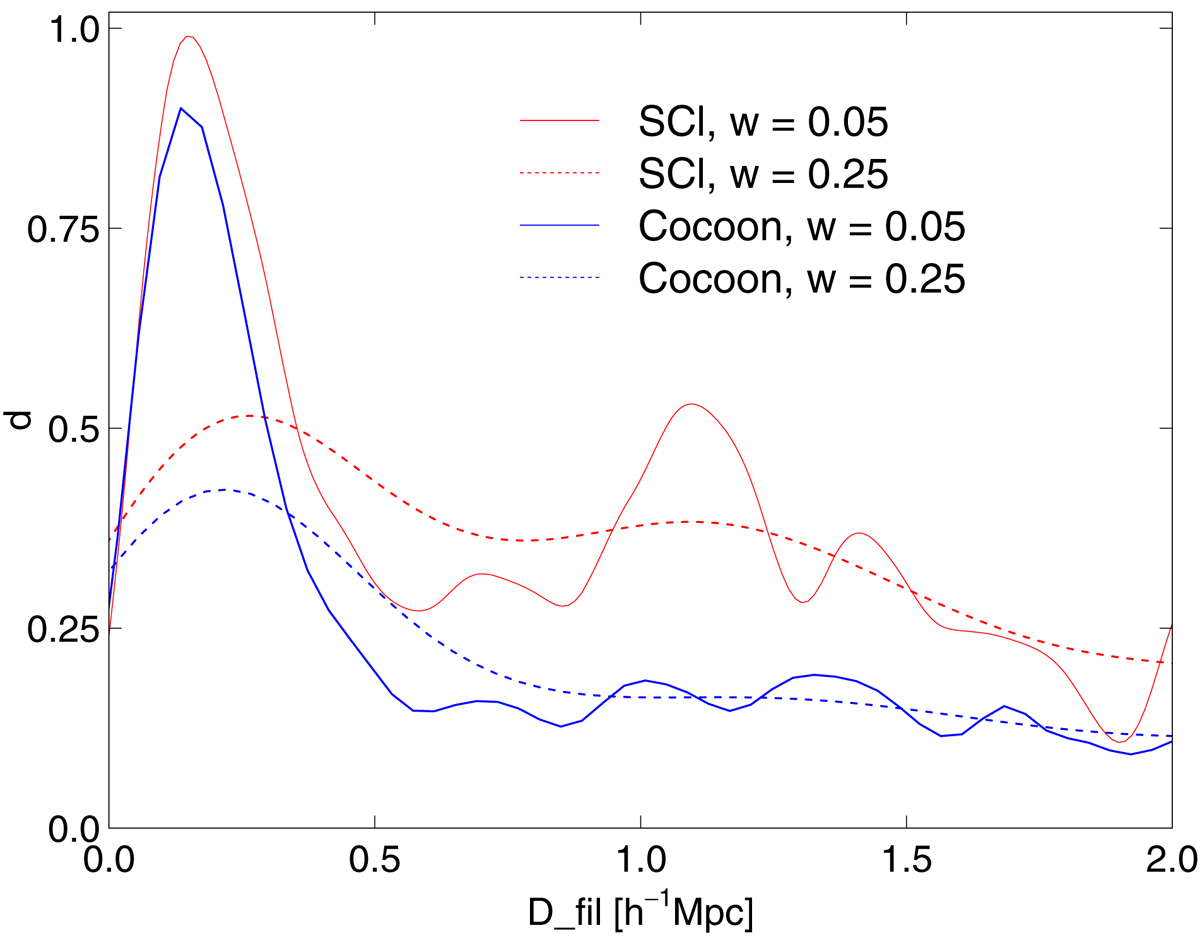
Distribution of distances Dfil from the nearest filament axis for galaxies in the supercluster (SCl, red lines) and in the cocoon (cocoon, blue lines). Solid lines show distributions calculated with high resolution kernel with width w = 0.05, and dashed lines show distributions calculated with low resolution kernel width, w = 0.25.
Current usage metrics show cumulative count of Article Views (full-text article views including HTML views, PDF and ePub downloads, according to the available data) and Abstracts Views on Vision4Press platform.
Data correspond to usage on the plateform after 2015. The current usage metrics is available 48-96 hours after online publication and is updated daily on week days.
Initial download of the metrics may take a while.