Fig. 14.
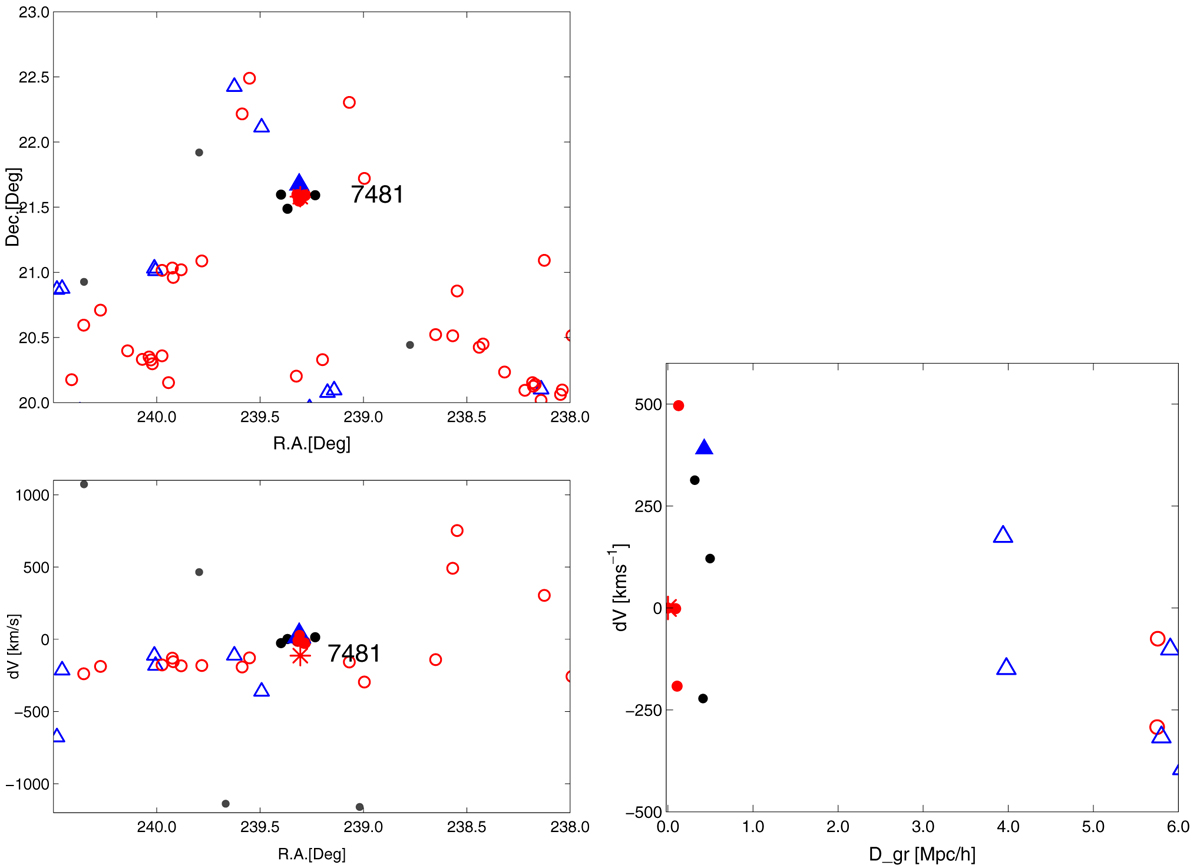
Sky distribution, and RA – velocity difference distribution for galaxies centred at the group Ggap (left panels), and PPS diagram for Ggap and its neighbourhood galaxies (right panel). Red circles denote VO galaxies, and blue triangles denote RSF galaxies. Filled symbols show group members, and empty symbols mark galaxies in the group neighbourhood. Other galaxies (blue star forming galaxies and red galaxies with stellar populations of intermediate age) are marked with grey dots.
Current usage metrics show cumulative count of Article Views (full-text article views including HTML views, PDF and ePub downloads, according to the available data) and Abstracts Views on Vision4Press platform.
Data correspond to usage on the plateform after 2015. The current usage metrics is available 48-96 hours after online publication and is updated daily on week days.
Initial download of the metrics may take a while.