Fig. 13.
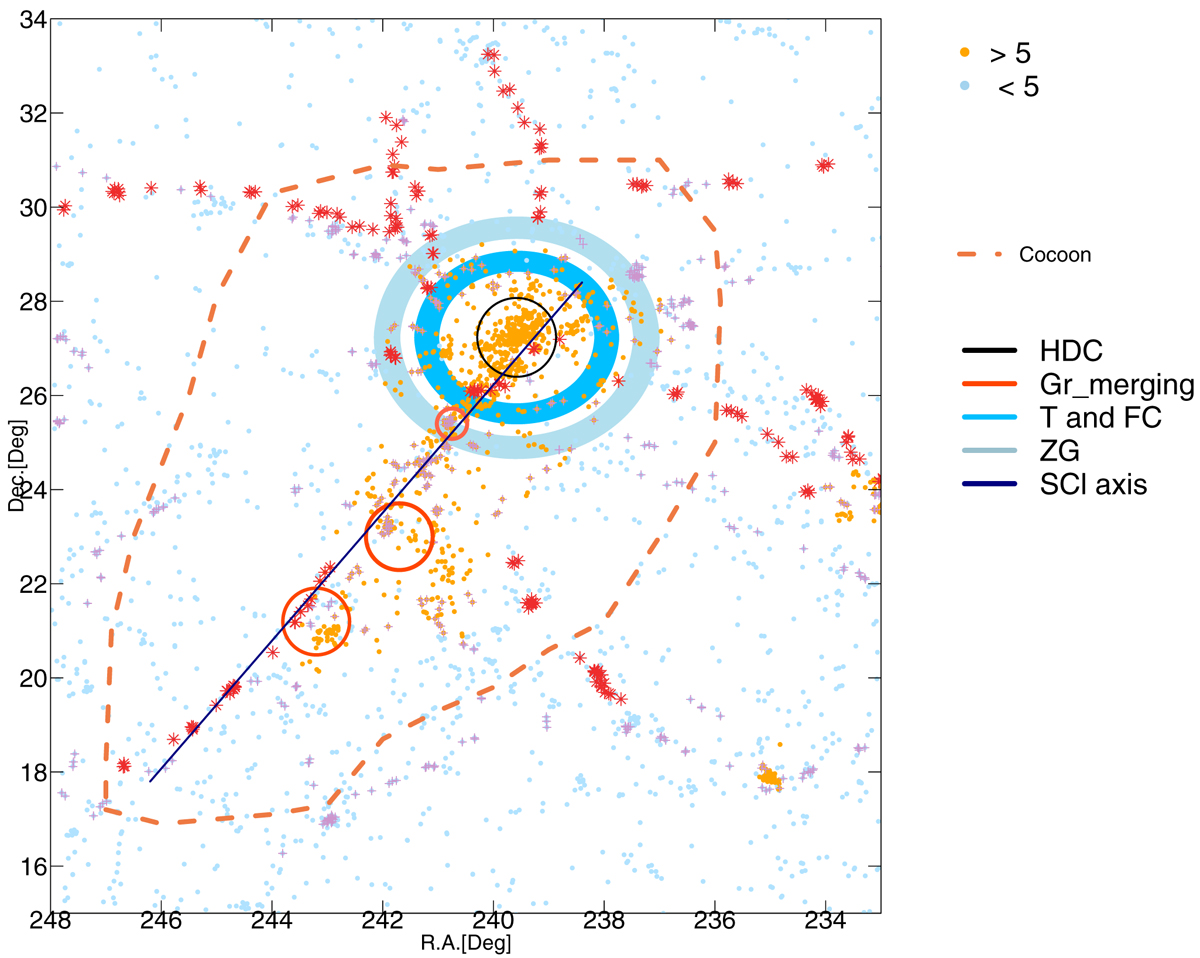
Distribution of galaxies and filaments in the sky plane in and around the supercluster SCl A2142. Colours denote galaxies in regions of different luminosity-density as in Fig. 1. Galaxies in short filaments are denoted with violet colour, and galaxies in long filaments with length ≥20 h−1 Mpc are denoted with dark red colour. HDC of the supercluster is marked with black circle. Orange circles mark the location of merging groups which will separate from the supercluster in the future. Blue stripe marks turnaround (T) region, and light blue circle shows borders of zero gravity (ZG) region where long filaments are detached from the supercluster (see text). Future collapse (FC) region lies between these regions. Navy line denotes the supercluster axis. Orange dashed line shows the cocoon boundaries.
Current usage metrics show cumulative count of Article Views (full-text article views including HTML views, PDF and ePub downloads, according to the available data) and Abstracts Views on Vision4Press platform.
Data correspond to usage on the plateform after 2015. The current usage metrics is available 48-96 hours after online publication and is updated daily on week days.
Initial download of the metrics may take a while.