Fig. 1.
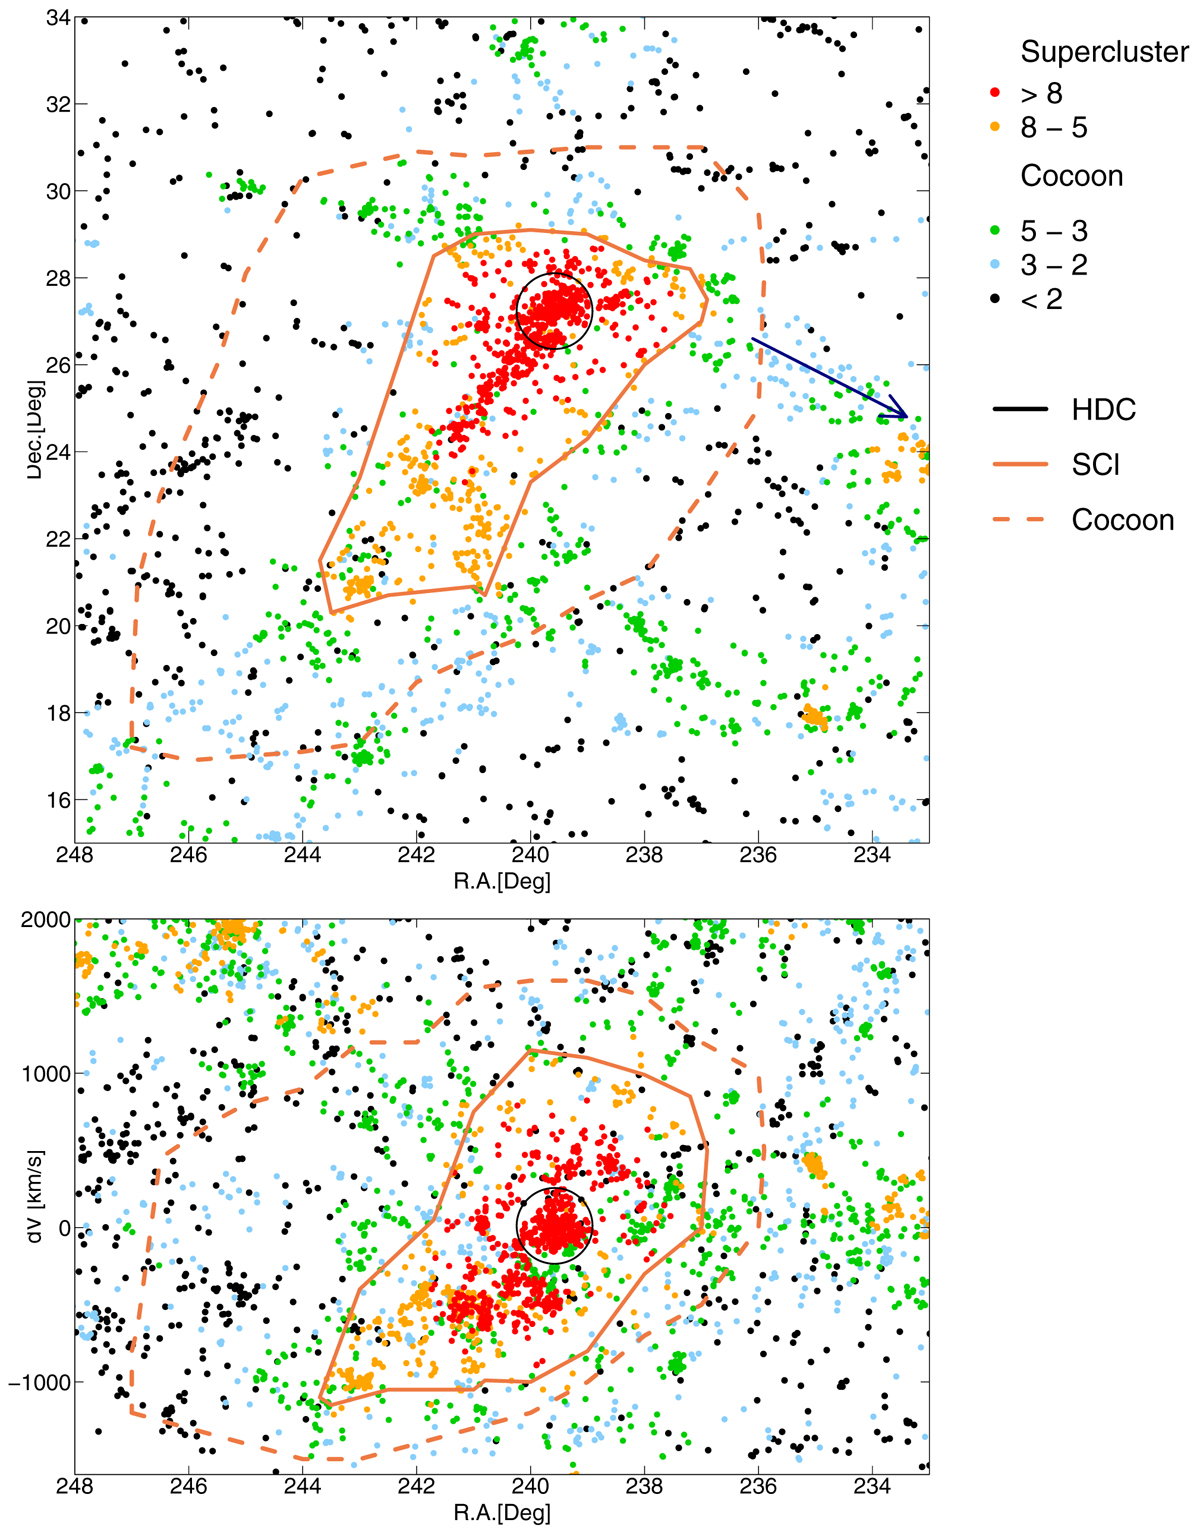
Distribution of galaxies in the supercluster SCl A2142 region. Upper panel shows galaxy distribution in the sky plane, and lower panel in the RA versus the difference between the galaxy velocity and the velocity of the cluster A2142 centre (dV). In upper panel distance limits are 250 − 275 h−1 Mpc (the distance to the A2142 centre is ≈265 h−1 Mpc), and in lower panel declination limits are 17 − 31 degrees. Colours denote galaxies in regions of different luminosity-density as follows. Red: D8 ≥ 8 (high-density main body of the supercluster), yellow: 5 < D8 ≤ 8 (outskirts of the supercluster), green: 3 < D8 ≤ 5, blue: 2 < D8 ≤ 3, and black: D8 ≤ 2, where D8 denotes the luminosity-density in units of the mean luminosity-density. Orange solid line approximately marks the boundaries of the supercluster, and orange dashed line shows the cocoon boundaries. Black circle shows the HDC of the supercluster. Navy arrow points towards the Corona Borealis supercluster.
Current usage metrics show cumulative count of Article Views (full-text article views including HTML views, PDF and ePub downloads, according to the available data) and Abstracts Views on Vision4Press platform.
Data correspond to usage on the plateform after 2015. The current usage metrics is available 48-96 hours after online publication and is updated daily on week days.
Initial download of the metrics may take a while.