Fig. 3.
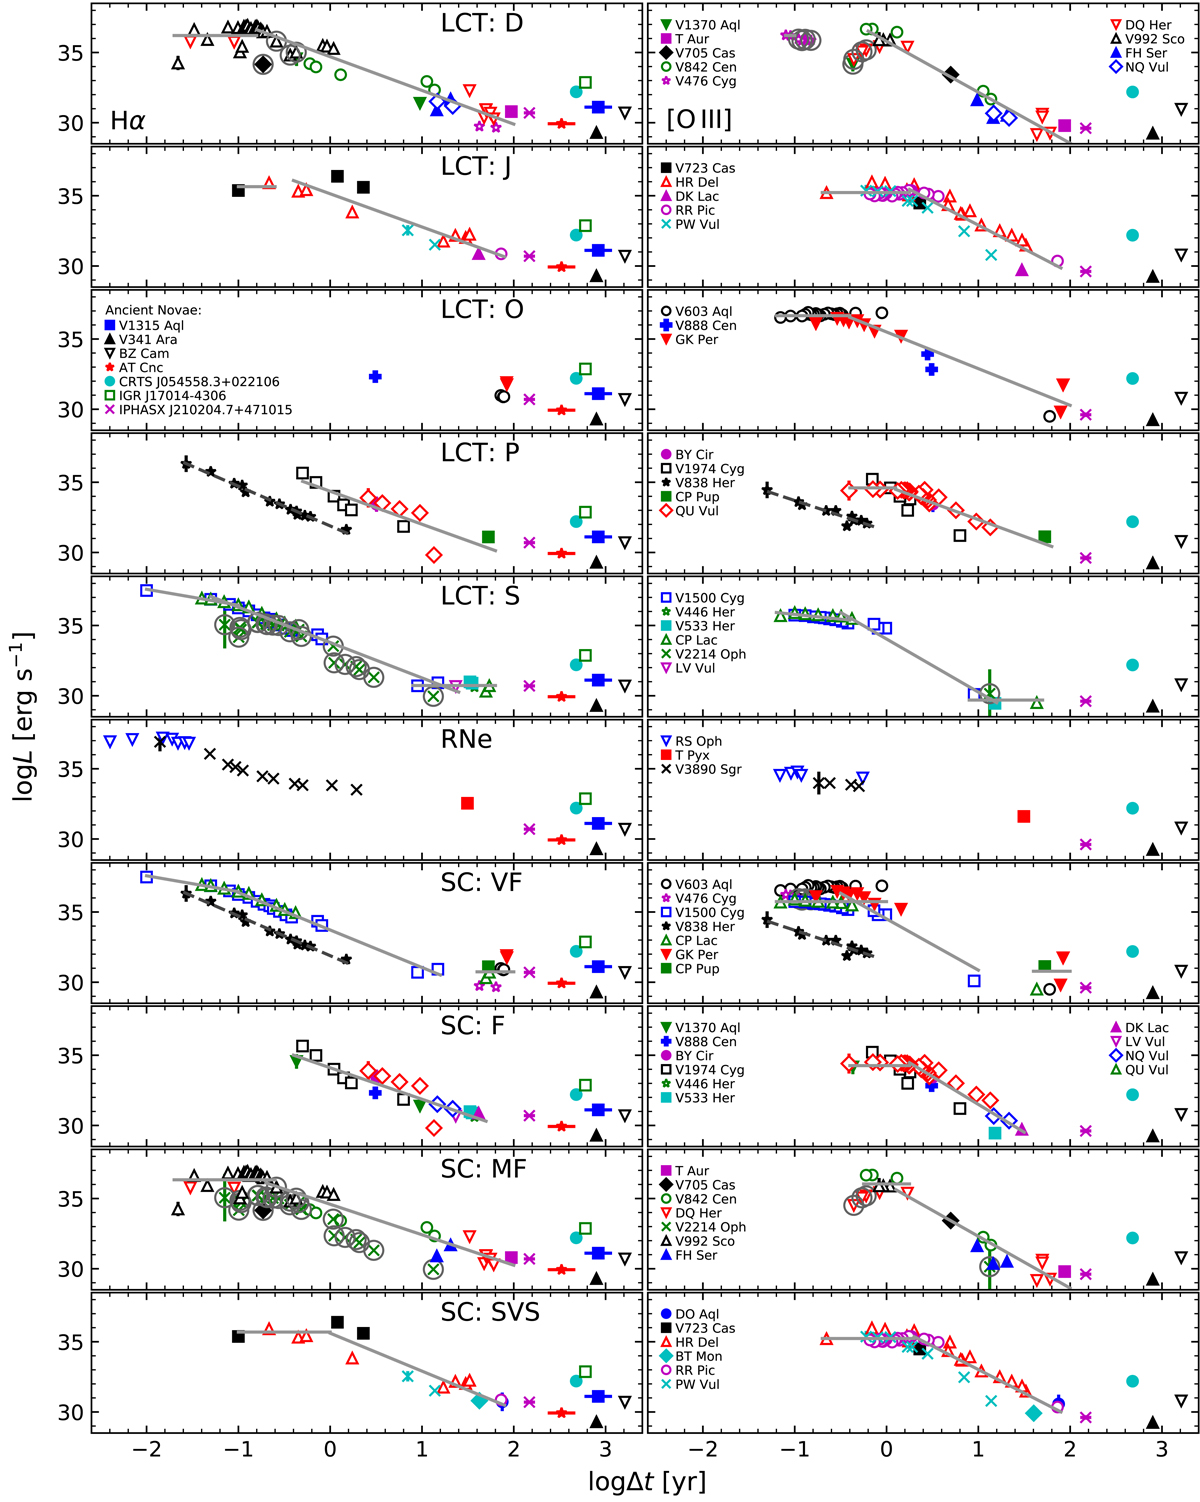
Hα (left panels) and [O III] (right panels) emission line luminosities as a function of the time that has passed since maximum brightness. Both parameters are shown in logarithmic scaling. The novae are grouped either with respect to their light curve type (LCT) or speed class (SC). The ancient novae have been incorporated in all plots, for comparison. The symbol identifications correspond to the respective plots of both emission lines. Symbols enclosed in larger grey circles indicate data points that were excluded from the fit. Error bars are shown only for the first data point of a respective object. Solid light grey lines represent linear fits to the data of a specific group, the dashed darker grey line shows the fits to the V838 Her data.
Current usage metrics show cumulative count of Article Views (full-text article views including HTML views, PDF and ePub downloads, according to the available data) and Abstracts Views on Vision4Press platform.
Data correspond to usage on the plateform after 2015. The current usage metrics is available 48-96 hours after online publication and is updated daily on week days.
Initial download of the metrics may take a while.