Free Access
Fig. 1
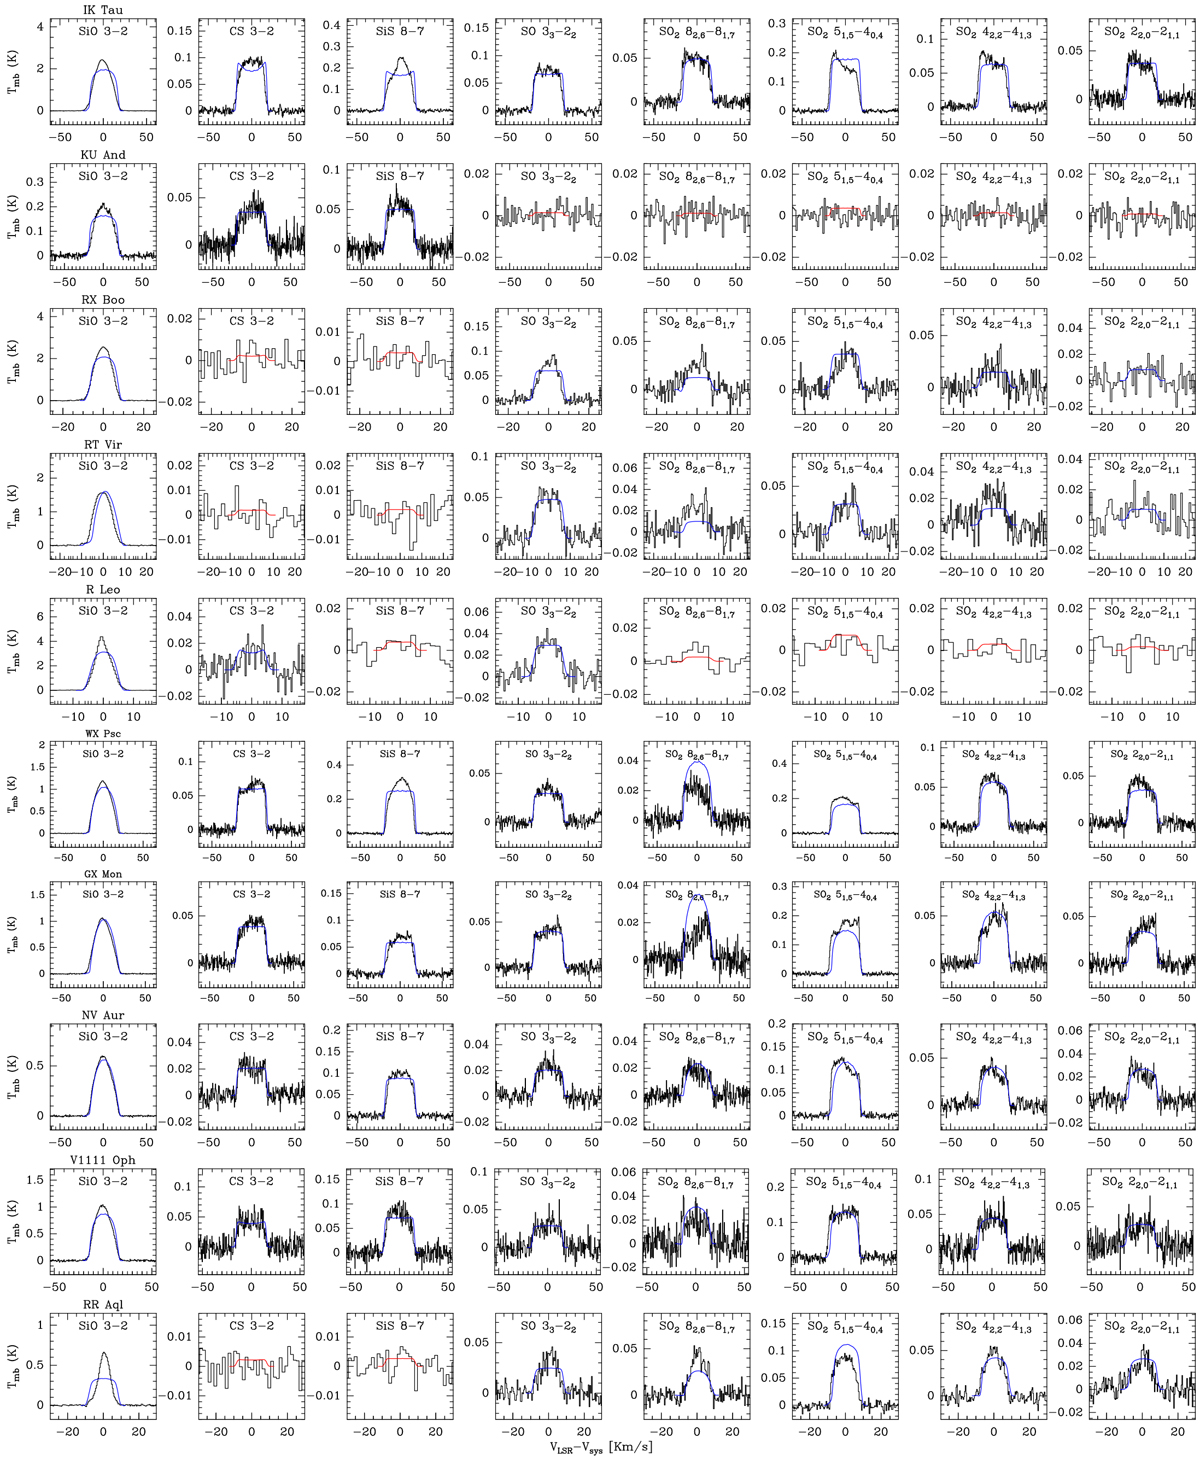
Rotational lines observed with the IRAM 30m telescope in the 30 O-rich CSEs (black histograms). The blue lines indicate the calculated line profiles from the best-fit LVG model. The red lines correspond to the calculated line profiles with the maximum intensity compatible with the nondetection.
Current usage metrics show cumulative count of Article Views (full-text article views including HTML views, PDF and ePub downloads, according to the available data) and Abstracts Views on Vision4Press platform.
Data correspond to usage on the plateform after 2015. The current usage metrics is available 48-96 hours after online publication and is updated daily on week days.
Initial download of the metrics may take a while.