| Issue |
A&A
Volume 641, September 2020
|
|
|---|---|---|
| Article Number | A37 | |
| Number of page(s) | 15 | |
| Section | Stellar structure and evolution | |
| DOI | https://doi.org/10.1051/0004-6361/202037812 | |
| Published online | 04 September 2020 | |
High-energy characteristics of the accretion-powered millisecond pulsar IGR J17591−2342 during its 2018 outburst
XMM-Newton, NICER, NuSTAR, and INTEGRAL view of the 0.3–300 keV X-ray band
1
SRON-Netherlands Institute for Space Research, Sorbonnelaan 2, Utrecht 3584, CA, The Netherlands
e-mail: This email address is being protected from spambots. You need JavaScript enabled to view it.
2
Tuorla Observatory, Department of Physics and Astronomy, University of Turku, 20014 Turku, Finland
3
Space Research Institute of the Russian Academy of Sciences, Profsoyuznaya Str. 84/32, 117997 Moscow, Russia
4
International Space Science Institute (ISSI), Hallerstrasse 6, 3012 Bern, Switzerland
5
International Space Science Institute Beijing, No. 1 Nanertiao, Zhongguancun, Haidian District, 100190 Beijing, PR China
6
School of Physics and Astronomy, Monash University, Australia, Clayton, VIC 3800, Australia
7
Monash Centre for Astrophysics, Monash University, Australia, Clayton, VIC 3800, Australia
8
Nordita, KTH Royal Institute of Technology and Stockholm University, Roslagstullsbacken 23, 10691 Stockholm, Sweden
9
Department of Physics, Xiangtan University, Xiangtan 411105, PR China
Received:
25
February
2020
Accepted:
16
June
2020
Abstract
IGR J17591−2342 is an accreting millisecond X-ray pulsar, discovered with INTEGRAL, which went into outburst around July 21, 2018. To better understand the physics acting in these systems during the outburst episode, we performed detailed temporal-, timing-, and spectral analyses across the 0.3–300 keV band using data from NICER, XMM-Newton, NuSTAR, and INTEGRAL. The hard X-ray 20–60 keV outburst profile covering ∼85 days is composed of four flares. Over the course of the maximum of the last flare, we discovered a type-I thermonuclear burst in INTEGRAL JEM-X data, posing constraints on the source distance. We derived a distance of 7.6 ± 0.7 kpc, adopting Eddington-limited photospheric radius expansion and assuming anisotropic emission. In the timing analysis, using all NICER 1–10 keV monitoring data, we observed a rather complex set of behaviours starting with a spin-up period (MJD 58345–58364), followed by a frequency drop (MJD 58364–58370), an episode of constant frequency (MJD 58370–58383), concluded by irregular behaviour till the end of the outburst. The 1–50 keV phase distributions of the pulsed emission, detected up to ∼120 keV using INTEGRAL ISGRI data, was decomposed in three Fourier harmonics showing that the pulsed fraction of the fundamental increases from ∼10% to ∼17% going from ∼1.5 to ∼4 keV, while the harder photons arrive earlier than the soft photons for energies ≲10 keV. The total emission spectrum of IGR J17591−2342 across the 0.3–150 keV band could adequately be fitted in terms of an absorbed COMPPS model yielding as best fit parameters a column density of NH = (2.09 ± 0.05) × 1022 cm−2, a blackbody seed photon temperature kTbb, seed of 0.64 ± 0.02 keV, electron temperature kTe = 38.8 ± 1.2 keV and Thomson optical depth τT = 1.59 ± 0.04. The fit normalisation results in an emission area radius of 11.3 ± 0.5 km adopting a distance of 7.6 kpc. Finally, the results are discussed within the framework of accretion physics- and X-ray thermonuclear burst theory.
Key words: pulsars: individual: IGR J17591−2342 / stars: neutron / radiation mechanisms: non-thermal / gamma rays: general / X-rays: general / X-rays: binaries
© ESO 2020
1. Introduction
Accreting millisecond X-ray pulsars (AMXPs) form a subset of low-mass X-ray binaries (LMXBs) that exhibit coherent millisecond pulsations during outburst, with spin periods ranging from 1.7 to 9.5 ms (based on the current sample of nineteen members). More information on the characteristics of this intriguing source class can be found in reviews by Wijnands et al. (2006), Patruno & Watts (2012), and Campana et al. (2018).
As with some other LMXBs, AMXPs typically exhibit transient outbursts (see e.g. in ’t Zand et al. 1998) as often as every few years, reaching luminosities of 1036 − 37 erg s−1 in the X-ray band. The outburst duration is typically a couple of weeks, however, there are a few exceptions, such as XTE J1807−294 (Linares et al. 2005), HETE J1900.1−2455 (Šimon 2018). and MAXI J0911−655 (Parikh & Wijnands 2019), which showed outburst durations of ≳150 days, ∼10.4 yr, and ∼3.2 yr, respectively.
It is believed that AMXPs are the progenitors of rotation-powered millisecond pulsars (RPMPs), which are mainly detected at radio frequencies and at gamma-ray energies, manifesting themselves either as a member of a binary system or as solitary stars. The underlying recycling scenario (Alpar et al. 1982; Radhakrishnan & Srinivasan 1982) assumes that during the accretion phase mass with large specific angular momentum is transferred towards a slowly rotating neutron star, which spins up as a result of accretion torques. It is expected that at the end of the active accretion phase, a millisecond pulsar turns on, shining from the radio- to the gamma-ray regime powered by the rotation of its magnetic field.
The link between RPMPs and AMXPs was recently established by the detection of three so-called “transitional” pulsars, FIRST J102347.6+003841 (PSR J1023+0038), IGR J18245−2452 (PSR J1824−2452I), and XSS J12270−4859 (PSR J1227−4853), which swing back from one state to the other state and vice versa (see e.g. Archibald et al. 2009; Stappers et al. 2014; Papitto et al. 2013; de Martino et al. 2010; Bassa et al. 2014; Roy et al. 2015, the first two citations are for PSR J1023+0038 and the latter three citations are for XSS J12270−4859).
Currently, nineteen members belonging to the AMXP class are discovered that went into full outburst (including our target IGR J17591−2342 and transitional ms-pulsar IGR J18245−2452). This sample excludes, however, the other two transitional pulsars PSR J1023+0038 and PSR J1227−4853, which both have not (yet) undergone a full outburst, and LMXB Aql X-1, which showed (intermittent) pulsed emission only during a small ∼120 s interval. To understand the evolution from the AMXP-stage to the RPMP-stage, better it is important to perform detail studies of the accretion-related phenomena in these transient systems, which spend most of the time in quiescence, through temporal, (pulse) timing, and spectral analyses of X-ray/soft γ-ray data collected across an energy band that is as wide as possible.
In the last decade(s), INTErnational Gamma-Ray Astrophysical Laboratory (INTEGRAL, Winkler et al. 2003) has turned out to serve as an efficient observatory for the discovery of new members, currently eight in total, of the AMXP class. This work focusses on a new member of the AMXP class, IGR J17591−2342, discovered by INTEGRAL on 2018 Aug. 12 (Ducci et al. 2018).
Soon after its discovery. the soft X-ray counterpart was detected by the XRT on-board of the Neil Gehrels Swift Observatory (Bozzo et al. 2018), yielding an improved location, followed by the identification as a 1.9 ms AMXP with a 8.8 h orbital period using NICER and NuSTAR observations (Ferrigno et al. 2018). Also, at radio frequencies (ATCA; 5.5 and 9 GHz) and in the near-infrared (NIR) band (Ks and H-bands; HAWK-I UT4 of the VLT). IGR J17591−2342 was detected (see Russell et al. 2018; Shaw & Degenaar 2018, respectively).
Interestingly, examination of archival Swift-BAT data (15–150 keV) showed that IGR J17591−2342 went off about 20 days before the discovery by INTEGRAL (Krimm et al. 2018), which was not able to observe the Galactic center region earlier because of observational constraints. Finally, the early findings obtained during activated ToO programs with the High-Energy transmission Grating Spectrometer aboard Chandra (Nowak et al. 2018) and with INTEGRAL and NuSTAR (Kuiper et al. 2018) were reported on, respectively.
From X-ray timing measurements (Sanna et al. 2018) and optical/NIR VLT X-shooter observations (see e.g. Sect. 2.4 of Nowak et al. 2019), the nature of the companion star could be determined. It could be classified consistently as a late-spectral type star with age between 8 and 12 Gyr and a mass in the range 0.85–0.92 M⊙, assuming a 1.4 M⊙ mass for the X-ray pulsar. In this case, the inclination of the orbit is rather low and in the range 28°–30°. Investigations by Russell et al. (2018) and Nowak et al. (2019) suggest that the source lies at a distance of > 6 kpc.
In this paper, we present the broad-band (0.3–300 keV) results using all available INTEGRAL-ISGRI (20–300 keV) data, including two ToO observations, NuSTAR (3–79 keV) ToO observations and one XMM-Newton (0.3–15 keV) ToO observation supplemented by NICER (0.2–12 keV) monitoring observations in order to shed light on the physical processes acting in this AMXP during its 2018 outburst and on the distance and the hydrogen column density NH to the system.
2. Instruments and observations
2.1. INTEGRAL
The INTEGRAL spacecraft (Winkler et al. 2003), launched on 2002 October 17, has two main γ-ray instruments aboard: a high-angular-resolution imager IBIS (Ubertini et al. 2003) and a high-energy-resolution spectrometer SPI (Vedrenne et al. 2003). To provide complementary observations in the X-ray and optical energy bands, the payload is further equipped by two monitoring instruments: the Joint European Monitor for X-rays (JEM-X; Lund et al. 2003) and the Optical Monitoring Camera (OMC; 500–600 nm). To enable image reconstruction in the hard X-ray/soft γ-ray band, the high-energy instruments make use of coded aperture masks.
The INTEGRAL Soft-Gamma Ray Imager (ISGRI; the upper detector system of IBIS, Lebrun et al. 2003) with its 19° ×19° field of view (50% partially coded) has an angular resolution of about 12′ and could locate and separate high-energy sources at an accuracy of better than 1′ (for a > 10σ source) in crowded fields with an unprecedented sensitivity (∼960 cm2 at 50 keV). Its energy resolution of about 7% at 100 keV is amply sufficient to determine the (continuum) spectral properties of hard X-ray sources in the ∼20–500 keV energy band. The timing accuracy of the ISGRI time stamps recorded on board is about 61μs.
JEM-X consists of two identical telescopes each having a field of view of  (diameter) at half response and is able to pinpoint a 15σ source with a 90% location accuracy of about 1′. Its timing accuracy (3σ) and energy resolution are 122.1 μs and 1.3 keV at 10 keV, respectively. In this work, guided by sensitivity considerations, we use only data recorded by ISGRI, sensitive to photons with energies in the range between ∼20 keV–1 MeV, and JEM-X operating in the 3–35 keV X-ray band.
In its default operation mode, INTEGRAL observes the sky in a dither pattern with 2° steps to suppress systematical effects, which could be either rectangular (e.g. a 5 × 5 dither pattern with 25 grid points) or hexagonal (with 7 grid points; target in the middle). Typical integration times for each grid point (pointing/sub-observation) are in the range 1800–3600 s. This strategy drives the structure of the INTEGRAL data archive which is organised in so-called science windows (Scw; ≡ one grid point) per INTEGRAL orbital revolution (Rev), which currently lasts for about 2.67 days, containing the data from all instruments for a given pointing. Most of the INTEGRAL data reduction in this study has been performed with the Offline Scientific Analysis (OSA) version 10.2 and 11.0 distributed by the INTEGRAL Science Data Centre (ISDC; see e.g. Courvoisier et al. 2003).
Shortly after the announcement of a new high-energy transient, IGR J17591−2342, in the INTEGRAL-ISGRI Galactic Center observations during satellite revolution 1986 (2018 Aug. 10–11) (Ducci et al. 2018; Ferrigno et al. 2018), we activated our coordinated INTEGRAL, NuSTAR and XMM-Newton target-of-opportunity programme to study IGR J17591−2342 in detail. In particular, INTEGRAL performed observations in hexagonal dither-mode during revolutions 1989 and 1992, lasting from August 17 14:03:53 to August 19 18:08:49 2018, and August 25 17:30:47 to August 27 17:34:10 of 2018, respectively. For our study we have used all available INTEGRAL observations with IGR J17591−2342 within  from the IBIS pointing axis, from its detection in Rev-1986 up to and including Rev-2016. This set includes data obtained in the course of observation programs 1520001 (Galactic bulge monitoring; PI E. Kuulkers), 1520022 (Continued Observation of the Galactic Center Region with INTEGRAL; PI J. Wilms), 1520038 (Galactic Center field: deep exposure; PI S.A. Grebenev), and 1420021 (Broad view on high energy Galactic background: Galactic Center; PI R.A. Sunyaev). We have screened the resulting data set further and excluded events registered during time periods where the ISGRI count-rate behaved erratically, for example near perigeum ingress or egress.
We performed a standard INTEGRAL ISGRI imaging (and subsequent mosaicking) analysis (Goldwurm et al. 2003), using the imaging S/W tools embedded in OSA 10.2, of all available Galactic Center observations of Rev-1986 adopting several broad energy bands. The significance map for the 20–60 keV band in Galactic coordinates, combining these Rev-1986 Galactic Center observations, is shown in Fig. 1. It covers a 12° ×8° region encompassing the new transient IGR J17591−2342, which is detected at a 13.8σ confidence level and marked by a white arrow. Other high-energy sources are indicated as well, including the (also in Rev-1986, JEM-X detected) new transient IGR J17503−2636 (Chenevez et al. 2018). LMXB GX 5−1, located at (l, b) = (+5.0802, −1.0234), that is, within  of IGR J17591−2342, is hardly detectable at energies above 20 keV; however, it shines brightly in the canonical ∼2–10 keV X-ray band, causing straylight complications in the analysis of the NuSTAR ToO observations discussed in Sect. 2.3.
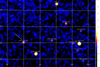 |
Fig. 1. INTEGRAL ISGRI 20–60 keV significance map in Galactic coordinates for Rev-1986 (MJD 58340.661-58341.806) of the sky region showing the new hard X-ray transient IGR J17591−2342, indicated by an arrow near (l, b) = (6,0), at a significance of ∼13.8σ. Other detected hard X-ray sources during this period are indicated as well among them, IGR J17503−2636, which was detected for the first time in JEM-X data during the Galactic bulge observations of Rev-1986 (Chenevez et al. 2018). |
Mosaics combining INTEGRAL-ISGRI data from Rev-1986 up to and including Rev-2006 (Aug. 10–Oct. 2, 2019) were also produced for several broad energy bands. The maps show that soft gamma-ray emission from IGR J17591−2342 is detected up to ∼150 keV, with a 8.2σ significance in the 120–150 keV band. Above, in the 150–300 keV band no source signal bf is found at the location of IGR J17591−2342. Finally, we performed a timing analysis of the ISGRI data outside the OSA environment selecting only those events from non-noisy detector pixels having a pixel illumination factor of at least 25% and with rise times between channels 7 and 90 (Lebrun et al. 2003).
2.2. NICER
The Neutron star Interior Composition ExploreR (NICER), launched on 2017 June 3, is an International Space Station payload dedicated to (spectral) timing analysis studies in the 0.2–12 keV band at an unprecedented time resolution of ∼100 ns with respect to UTC using GPS synchronisation (Arzoumanian et al. 2014). It consists of 56 X-ray concentrator (XRC) and matching silicon drift detector (SDD) pairs, which make up, in combination, the X-ray Timing Instrument (XTI), which registers photons at a ∼150 eV spectral resolution at 6 keV from a 6′-diameter field of view. The effective area in the 1–2 keV band is about twice as large as that of the XMM-Newton EPIC-pn. All these characteristics make this non-imaging instrument an excellent tool for the monitoring of (transient) X-ray sources at high time resolution.
NICER has started regular observations of IGR J17591−2342 on 2018 Aug. 14 (MJD 58345; Obs. id. 1200310101), a couple of days after the detection by INTEGRAL. The last observation has been taken on 2018 Oct. 17 (MJD 58408; Obs. id. 1200310139), when the source reached undetectable levels. The total on-source exposure time (37 observations combined; screened for background flares) is 93.41 ks. During the last two observations (Obs. ids. 1200310138/1200310139) performed on 2018 Oct. 16/17, respectively, for a total combined exposure of 5.455 ks IGR J17591−2342 is not detectable anymore, and so we have used these observations to estimate the local background. In this work the NICER data are mainly used to construct accurate timing models (ephemerides) for the rotational- and orbital motion of the neutron star in IGR J17591−2342, and to study the pulse profile morphology and (background subtracted) pulsed fraction as a function of energy.
2.3. NuSTAR
The Nuclear Spectroscopic Telescope Array (NuSTAR), launched on 2012 June 13, operates in the 3–79 keV band and provides for the first time fine imaging (angular resolution 18″ FWHM) for energies above 10 keV through its two depth-graded multilayer-coated Wolter-I (conical approximation) X-ray optics, which focus the hard X-rays onto two independent Focal Plane Modules (FPMA and FPMB), each composed of four solid state CdZnTe pixel detector arrays, separated from the optics at a ∼10 m focal length via a deployable mast (Harrison et al. 2013). Its field-of-view is about 10′ at 10 keV and decreases gradually at higher energies. The energy resolution ΔE/E is about 4% at 10 keV and 1% at 68 keV.
The focal plane instruments record events with a 2 μs precision. These intrinsic time stamps are related to an on-broad time reference system composed of a 24 MHz temperature compensated crystal oscillator. Next, the space-craft clock is correlated routinely with ground stations clocks having their own standards. The net effect of the correlation processes is that the original time tag of the recorded events is considerably blurred and is only accurate at the 2–3 ms level in UTC time system (Madsen et al. 2015), too coarse to perform detailed timing analysis for AMXPs. The main cause of the blurring originates from the variations of the clock frequency due to changes in the thermal environment of NuSTAR along its 96 minutes orbit around Earth. However, Gotthelf & Bogdanov (2017) have developed a method, applicable only for sources which are bright enough (∼75 counts per NuSTAR orbit) and with known ephemeris, to recover the NuSTAR relative timing with a resolution down to ≲15 μs.
NuSTAR has observed IGR J17591−2342 on 2018 Aug. 13 for 27.3 ks (Obs. id. 90401331002; public ToO-I; MJD ∼ 58344) and on 2018 Aug. 17 for 29.4 ks (Obs. id. 80301311002; our activated ToO-II; MJD 58348), see also the orange color bars in Fig. 2. For both observations in the subsequent analysis we have used the “cleaned” event files from the default NuSTAR pipeline analysis for both FPMA and FPMB. In particular, we have barycentered these event data using HEASOFT multi-mission tool barycorr v2.1 with NuSTAR clock-correction file #85 (valid up to 2018 Oct. 2), Solar System ephemeris DE405 and the optical position of IGR J17591−2342 (Shaw & Degenaar 2018). Furthermore, we have applied the correction method outlined in Sect. 2.2 of Gotthelf & Bogdanov (2017) to the timing analysis of the NuSTAR IGR J17591−2342 data. In the timing analysis we have used only events that are located in a circular region of radius 60″ around the optical location of IGR J17591−2342. To obtain “background” corrected source parameters like pulsed fraction (as function of energy) we chose a source-free circular background region located on the same chip with a radial aperture of 60″ centered at  .
.
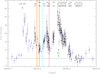 |
Fig. 2. Hard X-ray outburst profile of IGR J17591−2342 for the 20–60 keV band (INTEGRAL ISGRI; black data points). The flux is expressed in mCrab. Swift-BAT measurements for the 15–50 keV band are superposed (blue colored triangles; expressed in mCrab units as well). The onset of the 2018-outburst of IGR J17591−2342 starts around MJD 58320 and ends at MJD 58405, lasting for about 85 days. Multiple flares are visible, and during the one that reached maximum luminosity we detected a bright burst at the end of INTEGRAL Rev-2001, indicated by green arrows/line. The orange colored bands indicate the time intervals of the two NuSTAR ToO observations, while the red and cyan bands do so for the XMM-Newton and Chandra ToO’s, respectively. At the top of the panel the timeline of the INTEGRAL ISGRI Galactic Center observations are denoted by their corresponding revolution identifier. The onset of the outburst near MJD 58320, 20 days before the actual discovery of IGR J17591−2342 by INTEGRAL, as identified in Swift-BAT data (Krimm et al. 2018), is indicated as well. |
NuSTAR imaging analysis in different energy bands shows that IGR J17591−2342 is detectable across the full NuSTAR bandpass of 3–79 keV, however, below ∼20 keV straylight from GX 5−1 looms up hampering spectral analysis. Finally, we notice a decaying trend in the NuSTAR count rate during the first ToO observation of IGR J17591−2342, whereas during the second one, the count rate is increasing.
2.4. XMM-Newton
On 2018 Sept. 3 17:59:03 XMM-Newton started a 36.7 ks ToO observation of IGR J17591−2342 (MJD 58364.784–58365.166) at our request (Obs. id. 0795750101; XMM-Newton revolution-3431; see the red colored bar in Fig. 2). The (imaging) EPIC pn instrument (Strüder et al. 2001, 0.15–12 keV) aboard XMM-Newton has been operating in Timing Mode (TM) allowing timing studies at ∼30 μs time resolution. The other (imaging) EPIC instrument equipped with two cameras based on MOS CCDs (Turner et al. 2001), MOS-1 and MOS-2, has been put in Small window and Timing uncompressed modes, respectively. The latter mode can handle maximum count rates of up to 35 mCrab without pile-up complications and is suitable for our spectral study of the total emission of IGR J17591−2342. Its time resolution of ∼1.75 ms, however, is not sufficient for performing timing studies at ms-time scales. The incoming X-rays are attenuated through thin filters in front of the three EPIC instruments.
The (non-imaging) Reflection Grating Spectrometers (den Herder et al. 2001) on board XMM-Newton were operated in default mode (HighEventRate with Single Event Selection; HER + SES), collecting spectral information in the ∼0.35–2.5 keV band. We only used spectral data that was dispersed into the first order.
We ran the XMM-SAS pipeline analysis scripts (ODS-version 17.0; 2018-06-20) for all five XMM-Newton (X-ray) instruments. The XMM-Newton EPIC pn data have subsequently been barycentered using the SAS barycen 1.21 script adopting Solar System ephemeris DE405 and the optical position of IGR J17591−2342 (Shaw & Degenaar 2018). In the XMM-Newton EPIC-Pn timing analysis, we further selected on the one-dimensional spatial parameter RAWX by defining the source-region as RAWX interval [30,44] (15 pixels of width  = 61
= 61 5) and background region the union of RAWX [11,19] and [55,63] (18 pixels width in combination), chosen far from the source region.
We also checked the data for the presence of soft proton background flares, but we detected none, so further cleaning was not required. During the XMM-Newton observation, we noticed a (smoothly) decaying trend in the count rate of IGR J17591−2342.
3. The outburst profile at hard X-rays
The standard OSA INTEGRAL ISGRI imaging analysis has yielded deconvolved sky images for each science window providing count rate, count rate variance, significance, and exposure information across the field-of-view. From these maps, we extracted the count rates plus uncertainties of IGR J17591−2342 in the 20–60 keV band and compared them to those of the Crab (Nebula plus pulsar) from observations, Revs. 1987, 1991, 1996, 1999, 2000, and 2010, covering our IGR J17591−2342 observation period. The scatter in the Crab count rates (e.g. 20–60 keV rate: 1 Crab ≡110.4 c −1) is about 3–5% and, thus, negligible with respect to the IGR J17591−2342 count rate uncertainties. We typically combined five to seven data points to reach exposure times of about 10 ks. The results (black data points), based on all available INTEGRAL observations of the Galactic Center region from Rev-1986 till 2016 (i.e. Aug. 10–Oct. 29) are shown in Fig. 2. At the top of the plot the time line of the INTEGRAL Galactic Center observations, labelled with their associated revolution number, is indicated.
We complemented our ISGRI measurements with data (blue colored in Fig. 2) from the Swift-BAT Hard X-ray (15–50 keV) Transient Monitor programme (Krimm et al. 2013). The BAT data for period MJD 58300–58352 (July 1–August 22, 2018) have been obtained via private communication with Dr. H. Krimm. Clearly visible in Fig. 2 is that the outburst of IGR J17591−2342 actually started near MJD 58320 (Krimm et al. 2018) about 20 days earlier than its detection by INTEGRAL.
The total outburst of IGR J17591−2342 – with multiple flares – lasts for about 85 days, from MJD 58320 (2018 July 21) until 58405 (2018 Oct. 14), considerably longer than the typical outburst duration of two-three weeks for the majority of AMXPs. During the last, most prominent flare near MJD 58380, we discovered a bright type-I thermonuclear X-ray burst in INTEGRAL JEM-X data near the end of Rev-2001 (indicated by green arrows or the line in Fig. 2) Finally, the time intervals of target-of-opportunity observations by other high-energy instruments are shown: the two NuSTAR observations (orange), XMM-Newton (red) and Chandra (aqua).
4. Timing
Irrespective of the instrument, in timing analyses we have to convert the Terrestial Time (TT) arrival times of the (selected) events to arrival times at the solar system barycenter (in TDB time scale). We used in this process throughout in this work: (1) the JPL DE405 solar system ephemeris, (2) the instantaneous spacecraft position with respect to Earth center, and (3) the (most accurate) sub-arcsecond celestial position of the NIR counterpart of IGR J17591−2342:  for epoch J2000 (Shaw & Degenaar 2018, typical astrometric uncertainty of
  ), which corresponds to (l, b) = (+6.0213487, +0.070002) in Galactic coordinates (see also Fig. 1).
4.1. NICER timing analysis
For our timing analysis, we selected “cleaned” NICER XTI events from the standard pipeline analysis with measured energies between 1 and 10 keV. Events with energies between 12–15 keV, however, were used to flag periods with high-background levels (e.g. South Atlantic Anomaly ingress or egress, etc.) as bad, and these intervals have been ignored in further analyses. Moreover, events from noisy or malfunctioning detectors were ignored. The screened events were subsequently barycentered using a (multi-instrument serving) IDL procedure.
Next, we selected the barycentered arrival times from NICER observations 1200310101–1200310110 (MJD 58345–58364) for the 1–10 keV band and applied an optimisation algorithm based on a SIMPLEX optimisation scheme for four parameters simultaneously (see e.g. De Falco et al. 2017a, for the first application), that finds the global maximum of the  -test statistics (Buccheri et al. 1983) with respect to the rotational parameters,
  , and binary orbital parameters, Porb and Tasc, referring to the pulse frequency, frequency derivative, orbital period, and time of the ascending node, respectively (the pulse phase,
 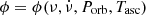 ).
).
In this process, the arrival time of each event is first corrected for the binary motion (thus involving Porb and Tasc, while keeping the eccentricity, e, fixed at 0 and projected orbital size of the neutron star orbit, ax ⋅ sin(i), at 1.227 716 lt-s, see Sanna et al. 2018) and is subsequently converted into pulse phase using ν and  (the other two free parameters). As start parameters for the optimisation procedure, we used the values given in column three of Table 1 of Sanna et al. (2018), that is, the NICER derived ephemeris characteristics evaluated for the time interval of MJD 58345–58354, which is about two times smaller than the interval width we use. Our derived orbital parameter values for Porb and Tasc are consistent with those given by Sanna et al. (2018) in their Table 1 (NICER column), but more accurate because of the longer baseline.
4.2. Timing solutions: ephemerides
The up-to-date accurate orbital parameters (see Table 1) have subsequently been used in correcting the (NICER) pulse arrival times for the orbital motion delays. Next, we have applied a so-called time-of-arrival (ToA) analysis yielding the most accurate estimates possible for the pulse frequency ν (and frequency first time derivative  , if required) over a certain time stretch (validity interval). The ToA method has been described earlier in detail in Sect. 4.1 of Kuiper & Hermsen (2009).
Positional, orbital, and rotational parameters derived in this work (or fixed to literature values) for IGR J17591−2342.
We identified two time intervals in the NICER observation sequence for which the timing behaviour of IGR J17591−2342 is relatively stable. The first segment lasts for about 20 days from MJD 58345–58364 (segment-1), and the second one for about 14 days from MJD 58370–58383 (segment-3). Between (segment-2) these segments and beyond MJD 58383 (segment-4) the pulsar shows noisy/erratic behaviour, very likely due to variations in the accretion torques. The best fit parameters for ν and  for these two segments are shown in Table 1 along with the epoch t0, the root-mean-square, RMS, of the fit and Φ0, a phase offset introduced to keep consistent alignment between different ephemerides.
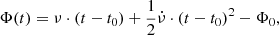
For the first segment we measure a significant positive value for  , indicating that spin-up is active during this period, while for segment-3 a constant spin frequency adequately fits the data. Between these segments, in segment-2 (MJD 58364–58370), a small drop in frequency of Δν ≃ −1.6 ⋅ 10−7 Hz occurs. Note, that the XMM-Newton ToO observation has been performed at the start of this period. The full set of NICER pulse arrival time residuals with respect to the timing model of segment-3 (i.e. model with constant frequency) is shown in the bottom panel of Fig. 3.
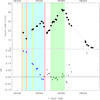 |
Fig. 3. Bottom panel: timing residuals of all NICER IGR J17591−2342 pulse template arrival times (in phase units) with respect to the best phase-coherent model (=constant frequency; see Table 1 ) for segment-3, which covers MJD 58370–58383 (green band/data points). Deterministic (segment-1, covering MJD 58345–58364, blue band/data points) as well as more noisy/erratic segments (e.g. segment-2 from MJD 58364–58370 and segment-4 for data beyond MJD 58383) are shown too. In orange, yellow and red the two NuSTAR, Chandra and XMM-Newton ToO’s are indicated, respectively. Top panel: data points and dashed line show the shape of the NICER 1–10 keV daily averaged count rate. |
It is clear from this plot that there is not any correlation between the residuals and the flux state, as represented by the NICER 1–10 keV background-subtracted count rates of IGR J17591−2342, (see top panel of Fig. 3).
We have also investigated the impact of the position uncertainty of  on the derived frequency and frequency derivative using the formulae given in Appendix A of Hartman et al. (2008). The frequency and frequency derivative offsets are: Δν ≲ 8 nHz and
 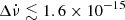 Hz s−1, respectively. The first value is comparable to the uncertainty in the measured frequency, while the second one is much smaller than the quoted frequency derivative uncertainty for segment-1, and so the location inaccuracy has no significant impact on the reconstructed values for the frequency and frequency derivative.
4.3. High-energy pulse profiles: NICER, XMM-Newton, NuSTAR and INTEGRAL-ISGRI
The availability of accurate phase-coherent ephemerides (see Table 1) makes a (multi-instrument) detail study possible of the energy dependence of the pulse profile of IGR J17591−2342. Pulse-phase folding the NICER barycentered event times, corrected for the orbital motion, from segment-1 (MJD 58345 – 58364; exposure 49.61 ks) observations, according to
 (1)
(1)
yields the pulse-phase distributions shown in Fig. 4 for three different measured energy bands: 1–3 (black), 3–5 (orange), and 5–10 keV (red).
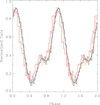 |
Fig. 4. NICER pulse profiles of IGR J17591−2342, using data collected during segment-1 (MJD 58345–58364), for three different energy bands: 1–3 keV (including truncated Fourier series fit with three harmonics: black), 3–5 keV (orange), and 5–10 keV (red). The shift towards earlier phases of the higher energy profiles is evident. |
From this (NICER only) plot it is already clear visually that the more energetic photons of the double-peaked pulsed emission component arrive earlier than the softer photons. In the next section, a detailed profile analysis including NICER, XMM-Newton and NuSTAR data provides all quantitative information related to this across the ∼1–50 keV band. We also studied the stability of the pulse shape in the 1–3 keV NICER band as a function of time and found no significant changes, meaning that the profile morphology is stable across the time window that NICER observed IGR J17591−2342 in spite of drastic flux changes.
The NICER 1–3 keV data at various outburst stages were further used to determine the relation between the pulsed flux CPulsed and (background corrected) total flux Ctotal. We find that both quantities are tightly correlated, as expected, with a CPulsed/Ctotal ratio of ∼11% consistent with the results shown later in Sect. 4.4 for the 1–3 keV band, and so the pulsed fraction is independent of the flux state of the source.
Next we applied the timing models shown in Table 1 in timing analyses of the other high-energy instruments adopting methods, screening procedures, and selections outlined in the instrument Sects. 2.1–2.4, for INTEGRAL-ISGRI, NuSTAR, and XMM-Newton EPIC-Pn, respectively.
The XMM-Newton data were taken at the very beginning of segment-2 (for which no phase-coherent ephemeris is available) very near the end of segment-1 and so the timing data were folded upon the parameters listed under ephemeris-1 in Table 1, taking into account that a small phase shift can occur between the NICER, as baseline and XMM-Newton EPIC-Pn profiles. Cross-correlation of XMM-Newton and NICER 1–10 keV pulse-profiles does indeed show a small phase shift of −0.043 as expected. Even above 10 keV, a significant pulsed signal is detected at a 6.2σ confidence level, adopting a  -test (see e.g. panel g in Fig. 5).
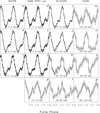 |
Fig. 5. High-energy pulse profiles as function of energy for IGR J17591−2342 using NICER (MJD 58345–58364; segment-1), XMM-Newton, NuSTAR (MJD 58344; ToO-I), and INTEGRAL ISGRI (Revs. 1986–2006) data covering the 1–120 keV energy band. Pulsed emission has been detected significantly up to ∼120 keV. |
The NuSTAR data has been taken from ToO-I which has the highest statistics among the two NuSTAR ToO’s. Application of the correction method reported by Gotthelf & Bogdanov (2017), using the ephemeris-1 parameters and the NICER 3–10 keV pulse-profile as phase-alignment baseline yields pulsed signal detections up to ∼50–60 keV: the 35–60 keV band yields a 4.6σ pulsed signal detection applying a  -test (see e.g. panel l in Fig. 5).
INTEGRAL-ISGRI timing data from Revs 1986, 1989, 1992, 1994–1995, 1998, 2001–2003, (and 2004–2006) were folded upon the ephemerides listed in Table 1, some in extra-polation mode. Pulsed emission was detected significantly up to ∼120 keV with a signal strength of about 4.1σ in the 90–120 keV energy band (see e.g. panel p in Fig. 5).
The full set of pulse-phase distributions resulting from pulse-phase folding the barycentered event times upon the ephemeri(de)s parameters listed in Table 1 is shown in Fig. 5 for the four different high-energy instruments covering the 1–120 keV band: NICER (1–10 keV; left panels a-c), XMM-Newton (1–15 keV; middle left panels d-g), NuSTAR (3–60 keV; middle right panels i-l), and INTEGRAL ISGRI (20–120 keV; right panels m-p).
4.4. Timing results: pulsed fraction, phase-angle
To obtain quantitative information about morphology changes of the pulse-profile as a function of energy we have produced pulse-phase distributions in narrow energy bands for NICER, XMM-Newton, and NuSTAR covering the ∼1–50 keV band (all segment-1 data except XMM-Newton (early segment-2; see Sect. 4.2), folded upon segment-1 ephemeris). These measured distributions 𝒩(ϕ) have subsequently been fitted with a truncated Fourier series ℱ(ϕ) given by
 (2)
(2)
with ϕk = arctan(bk/ak) and  . For each harmonic maxima can be found at ϕmax = ϕk mod (2π/k) (in radians).
The results of these fits are shown in Fig. 6 with the fractional background corrected amplitude, Ak/A0, in the left panel and the phase angle, ϕk, in the right panel, now mapped from radians to (pulse) phase that is, the range [0,1]. The fundamental, k = 1, is coloured black, while the first, k = 2, and second, k = 3, overtone are coloured red and orange, respectively. It is clear from these energy-resolved results that the pulsed fraction of the fundamental increases from about 10% to 17% moving from 1.5 to 3–4 keV, and beyond this point, it fluctuates a bit around 17%. This is consistent with the energy integrated result reported by Sanna et al. (2018). The first overtone shows a ∼6% contribution and the second a ∼ 1–2% to the pulsed fraction, also consistent with Sanna et al. (2018).
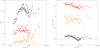 |
Fig. 6. Left: fractional amplitude of various harmonics (1 – fundamental, 2 – first overtone, and 3 – second overtone) as a function of energy using background corrected data from XMM-Newton EPIC-pn (circles), NICER (squares) and NuSTAR (triangles). The pulsed fraction of the fundamental component increases from ∼10% till ∼17% from 1.5 to 3–4 keV, from where it more or less saturates at a level of ∼17%. Right: phase-angle as function of energy for the three Fourier components. The shift towards lower phases from ∼1.5 keV till ∼10 keV for both the fundamental and first overtone is evident. |
From the phase angle plot (Fig. 6 right panel), the decreasing trend in angle for increasing energies till ∼10 keV for both the fundamental and first overtone is evident, meaning that the higher energy photons of the pulsed component arrives earlier than the softer ones. This has already been shown for NICER data alone in Fig. 4. The total phase decrease is about 0.05 (∼95 μs) going from 1.5 to 10 keV.
5. Broad-band spectral analysis of the total emission
In this section, we report on the analysis of the averaged broad-band spectral properties of IGR J17591−2342, a source that was intensively observed with different observatories covering a broad energy range. These different pointings were taken over the whole outburst, however, they covered various intensity states of the source (see Fig. 2). Therefore, to reproduce the broad-band energy spectrum, we used XMM-Newton, NuSTAR, and INTEGRAL observations, performed either close in time or during similar intensity states. For the high-energy part, we made use of the INTEGRAL ISGRI spectrum covering the 30–150 keV energy range, as obtained during revolutions 1994 and 1995, which covers the XMM-Newton observation (see Fig. 2). We fit these data together with the XMM-Newton EPIC-pn (1.5–12 keV)1, XMM-Newton EPIC-MOS2 (0.5–10 keV), RGS 1 and 2 (∼0.33–2.1 keV) data from XMM-Newton observation 0795750101, and NuSTAR FPMA/FPMB data (3.5–79 keV) from observation 90401331002. All XMM-Newton EPIC-pn and EPIC-MOS2 and NuSTAR spectra of the source were optimally rebinned using the prescription in paragraph 5.4 of Kaastra & Bleeker (2016). The XMM-Newton RGS spectra of the first dispersion order were rebinned with a minimum number of 25 photons per energy bin. The spectral analysis was carried out using XSPEC version 12.6 (Arnaud et al. 1996). All uncertainties in the spectral parameters are given at a 1σ c.l. for a single parameter. We applied an additional systematic uncertainty of 2% for each instrument due to uncertainties in the spectral responses of each involved instrument.
At first, we fitted the combined spectra using a simple absorbed power-law model, also including normalisation constants in the fit to take into account uncertainties in the cross-calibrations of the instruments and the source variability (the data are not covering strictly the same time interval of the source outburst). This first fit provided an absorption column density of NH = (3.01 ± 0.02) × 1022 cm−2, a power-law photon index Γ = 1.84 ± 0.01, and a relatively large 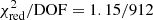 , due to the “wavy” residuals at all energies and significant deviations from a pure power law at energies above ∼80 keV. Although the fit was not formally acceptable, we noticed that the values of the normalisation constants were all in the range 1.0 ± 0.2, compatible with the finding that the average spectral properties of the source during the considered part of the outburst were stable. A similar range for the normalisation constants was also found in all other fits reported below (we assumed in all cases the NuSTAR FPMA as our reference instrument and fixed its normalisation constant to unity). Our derived NH value is inconsistent with the value of (4.4 ± 0.3) × 1022 cm−2 reported by Russell et al. (2018), who used only Swift-XRT data covering the 0.5–10 keV band in an absorbed power-law fit, thus lacking spectral band-width and sensitivity.
We also fitted the averaged broad-band spectrum of IGR J17591−2342 with an absorbed thermal Comptonisation model NTHCOMP in XSPEC (see e.g. Zdziarski et al. 1996; Życki et al. 1999) to take into account the emission produced by a thermal distribution of electrons which Compton up-scatter the soft seed X-ray photons. Our fit has five free fit parameters: the absorbing hydrogen column density NH, seed photon temperature kTbb, seed, electron temperature kTe, asymptotic power-law photon-index Γ, and normalisation factor K, while we fixed the input type for the seed photons to 0 (i.e. blackbody seed photons) and put the redshift, z, to 0 for this model. This more physically motivated spectral model provided a statistically better fit than the phenomenological power-law model described above. Although the results of this fit, summarised in Table 2, are quantitatively similar to those previously reported, we noticed that our measured absorption column density, NH, of (2.25 ± 0.05) × 1022 cm−2, is considerably lower, but compatible at 2σ confidence, than the NH value of (3.6 ± 1.1) × 1022 cm−2 reported by Sanna et al. (2018) who adopted an equivalent spectral model across the 0.5–80 keV band using Swift-XRT (0.5–7.5 keV), NuSTAR 3–70 keV), NICER (> 1.4 keV), and INTEGRAL-ISGRI (30–80 keV). We ascribe the difference to the fact that we are using a wider energy range, especially the coverage below ∼1.5 keV by including accurate spectral data from the high-sensitivity instruments XMM-Newton RGS 1 & 2 and EPIC-MOS2 (compared to Swift-XRT) down to ∼0.33 keV. Our value of NH is compatible at 2σ confidence with that from model C reported by Nowak et al. (2019) (providing the “fairest estimate for the equivalent neutral column”; see their Sect. 4.2), NH = (2.9 ± 0.5) × 1022 cm−2, obtained using Chandra-HETG 1–9 keV data, and also assuming a Comptonised blackbody continuum. The main difference between the results of Sanna et al. (2018) and Nowak et al. (2019) is the temperature of the seed photons, kTbb, seed ∼ 0.79 keV and kTbb, seed ∼ 0.06 keV, respectively. Our best-fit value for the blackbody seed photons, however, is kTbb, seed ∼ 0.52 keV (see Table 2).
Best parameters determined from the fits to the total broad-band emission spectrum of IGR J17591−2342 performed with the XMM-Newton, NuSTAR and INTEGRAL using the PHABS absorbed comptonisation models NTHCOMP or COMPPS, respectively.
To compare the total broad-band emission spectrum of IGR J17591−2342 with those of other AMXPs observed at hard X-rays with INTEGRAL (e.g. Gierliński et al. 2002; Gierliński & Poutanen 2005; Falanga et al. 2005a,b, 2011, 2012, 2007; Ibragimov & Poutanen 2009; De Falco et al. 2017a,b; Li et al. 2018), we also performed a spectral fit using a thermal Comptonisation model (COMPPS) in the slab geometry (Poutanen & Svensson 1996). The main fit parameters are the absorption column density NH, the Thomson optical depth τT across the slab, the electron temperature kTe, the temperature kTbb, seed of the soft-seed thermal photons (assumed to be injected from the bottom of the slab), and the normalisation of the model K, which for black body seed photons equals K = (Rkm/D10)2 with Rkm the radius of the source in km and D10 the source distance in units 10 kpc. The results of this fit are reported in Table 2 and are compatible with those measured from other AMXPs in outburst. We show in left panel of Fig. 7 the absorbed (unfolded or deconvolved) total broad-band emission spectrum of IGR J17591−2342, together with the residuals from the best-fit model at the bottom.
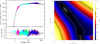 |
Fig. 7. Unfolded absorbed broad-band spectrum of IGR J17591−2342 in the 0.3–150 keV energy range (left panel). The data points are obtained from the two XMM-Newton RGS instruments (yellow and magenta datapoints, ∼0.33–2.1 keV), XMM-Newton EPIC-pn (green points, 1.5–12 keV), XMM-Newton EPIC-MOS2 (cyan points, 0.5–10 keV), NuSTAR FPMA/FPMB (red and blue points, 3.5–80 keV), and INTEGRAL-ISGRI (black points, 30–150 keV). The fit is obtained with the COMPPS model, represented in the top panel with a solid black line. The residuals from the best fit are shown at the bottom. The right-hand panel shows the correlation between NH and kTBB in the COMPPS model: two minima co-exist. The contours encompassing the minima denote the 1, 2, and 3σ confidence levels assuming 2 degrees of freedom (DOF), while the others are labeled with their corresponding χ2-value (note: the DOF is 910). |
The absorption column density measured from the fit with the COMPPS model is a bit less, but compatible at the 2σ-level with the value obtained using the NTHCOMP model. It is noteworthy that our derived NH of ∼2.09 × 1022 cm−2 is consistent with the estimate of the total Galactic column contribution of ∼2.2 × 1022 cm−2 based on reddening maps (see Sect. 3.3 of Russell et al. 2018, for a discussion on this) and, thus, there is no need for additional intrinsic absorption from the source environment. Our value is somewhat larger than the atomic neutral hydrogen column NH, Gal of (1.12–1.44) × 1022 cm−2 (Dickey & Lockman 1990; Kalberla et al. 2005), however, the difference can be attributed to a molecular hydrogen contribution, which can be quite significant in the Galactic bulge direction.
We studied the correlation between the fit parameters in the COMPPS model. In particular, the 2d-XSPEC fitting result for the correlation between NH and kTbb, seed has two local minima corresponding to two pairs of NH and kTbb, seed values. The main minimum corresponds to a low absorption column NH ∼ 2.09 × 1022 cm−2 and a high seed photon temperature kTbb, seed ∼ 0.64 keV, whereas the other minimum gives a higher NH of ∼2.93 × 1022 cm−2 and a lower seed photon temperature kTbb, seed ∼ 0.05 keV, the latter seems to be compatible with spectral model C given in Nowak et al. (2019). The existence of the two minima might also explain the large difference in the blackbody temperatures obtained by Sanna et al. (2018) and Nowak et al. (2019). This situation is illustrated in the right hand panel of Fig. 7 where the 1, 2, and 3σ confidence, assuming 2 degrees of freedom, contours are shown around the (two) minima for the NH versus kTbb, seed correlation as well as contours labeled with their corresponding χ2-values, starting at 1000 in steps of 1000 (note DOF is 910). A similar (more mildly) correlation exists between the COMPPS model parameters kTe and τT.
To assess possible (reflection related) emission from the iron Kα complex (near 6.40 keV; see e.g. Sanna et al. 2018) we added a Gaussian line with free energy location, width and normalisation to the absorbed COMPPS-model. Although the fit formally improves at a 4.9σ level (for 3 parameters), the “best” line location of  keV and line width of
  keV are too far off and too broad. The emission feature could be a manifestation of a blend of lines from different Fe ionisation stages when measured with CCD spectral resolution. However, it is more likely that it reflects uncertainties in the XMM-Newton EPIC-pn (in timing mode) response description (see the green data points in the bottom panel of Fig. 7) because in the Chandra-HETG data with superior energy resolution (with respect to the EPIC-Pn CCD spectral resolution), there is no evidence for iron Kα emission (see Fig. 6 of Nowak et al. 2019) and so, we do not consider this a real detection.
An advantage of the COMPPS model is that it allows us to estimate the apparent radius Rkm of the thermally emitting region on/near the NS surface from  . At the distance of IGR J17591−2342 of d ∼ 7.6 kpc (see Sect. 6.1), the radius of this region is 11.3 ± 0.5 km, compatible with the radius of a neutron star.
6. Thermonuclear (type-I) burst detected in INTEGRAL JEM-X data
Thermonuclear (type-I) X-ray bursts are produced by the unstable burning of accreted matter on the NS surface. The spectrum from a few keV to higher energies can usually be well described as a blackbody with temperature kTbb∼1–3 keV. The energy-dependent decay time of these bursts is attributed to the cooling of the NS photosphere and results in a gradual softening of the burst spectrum (see Lewin et al. 1993; Strohmayer et al. 2006, for a review).
We scrutinised the NICER, XMM-Newton EPIC-MOS/PN, Swift-XRT, and NuSTAR data for the presence of thermonuclear bursts at different time scales (1, 10, and 100 s), but we found none. Next we focused on INTEGRAL JEM-X (3–35 keV) data and identified one thermonuclear burst candidate. We describe the analysis of the JEM-X data covering the event below.
6.1. Properties of the type-I X-ray burst
We searched INTEGRAL/JEM-X data for bursts within revolutions 1986–2009, following the same approach as Mereminskiy et al. (2017). We focussed on one of the two JEM-X cameras, JEM-X1; JEM-X2 was operating simultaneously, but this instrument seems to be experiencing reduced sensitivity in recent years. We identified one candidate thermonuclear (type-I) burst from IGR J17591−2342, in Scw-500010 of INTEGRAL revolution 2001 on Sept. 19, 2018; 23:07:33 (MJD 58380.96358 TT). The key properties of the burst are listed in Table 3. Based on its intensity, this burst should have also been detectable by ISGRI; however, due to the loss of sensitivity over time in the lower ISGRI energy band, 18–27 keV, we did not detect this event in those data.
Parameters of the type-I X-ray burst observed by INTEGRAL JEM-X during the outburst of IGR J17591−2342 in 2018.
The type-I X-ray burst occurred ∼60 d after the outburst commenced, just after the source was at the highest X-ray luminosity (see Fig. 2). We defined the burst start time as the time at which the X-ray intensity of the source first exceeded 10% of the burst peak flux (above the persistent intensity level). The event showed a fast (∼1–2 s) rise time, followed by a ∼10 s long plateau at its peak (Fig. 8). Therefore, we conclude that most likely a photospheric radius expansion took place (see e.g. Falanga et al. 2007; Galloway et al. 2008; Bozzo et al. 2010). After the plateau, the burst decay profile could be well fitted with an exponential function and the correspondingly derived e-folding time is τfit ∼ 9 s. The total duration of the burst was ∼40 s.
 |
Fig. 8. Light curve of the type-I X-ray burst detected by JEM-X and reported for the first time in this paper. The burst start time was 58380.96358 MJD. The JEM-X light curve was extracted in the 5–25 keV energy range with a time bin of 2 s. |
For the burst spectral analysis, we first determined the persistent flux before the burst onset by converting the ISGRI counts from Rev-2001 to the total broadband spectrum obtained from Revs. 1994–1995 (see Sect. 5). We note that during the outburst, the ISGRI data in the 20–150 keV band alone were fitted by a power-law model, and the spectral parameters were stable. The pre-burst flux was Fpers, bol ∼ 1.2 × 10⁻⁹ erg cm−2 s−1.
We analysed the burst spectra over the 3–25 keV band and then extrapolated the data to the 0.1–40 keV broad-band. This is justifiable for the JEM-X data since the blackbody temperature is well inside the spectral energy coverage. We carried out two spectral analyses of the JEM-X data covering the burst event, one to determine the burst peak flux during the 10 s (plateau) time interval and a second to determine the fluence integrated over the total burst duration of 40 s.
The net burst spectra were both well-fitted ( = 0.98) adopting a simple tbabs*bb model, with the absorption column fixed at NH = 2 × 1022 cm−2. The estimated fluence was fb ∼ 1.1 × 10⁻⁶ erg cm−2 and peak flux Fpeak ∼ 7.6 × 10⁻⁸ erg cm−2 s−1.
We estimated the burst energy, including a consideration of the expected anisotropic X-ray emission arising from the non-axisymmetric distribution of mass around the neutron star. The total X-ray luminosity LX is estimated from the flux fX as:
 (3)
(3)
where d is the distance to the source, ξb, p is the anisotropy factor, and the subscripts b and p correspond to the burst and persistent emission, respectively (Fujimoto 1988). He & Keek (2016) carried out simulations to predict the anisotropy factor based on different disk geometries; here we adopt their model “a”, corresponding to a flat, optically thick disk. Over the relatively narrow inclination range of 28–30°, the predicted anisotropy factor for the burst (persistent) flux is ξb = 0.71 (ξp = 0.49). Values ξb, p < 1 imply the flux is preferentially beamed toward us, so that the inferred isotropic luminosity would be significantly above the actual value. We estimated the distance by equating the peak flux with the empirical Eddington luminosity of Kuulkers et al. (2003) and including the anisotropy factor, as  kpc. The corresponding bolometric persistent luminosity prior to the burst was 4.1 × 1036 erg s−1, (i.e. ∼1.1% LEdd, where LEdd = 3.8 × 1038 erg s−1 is the Eddington luminosity).
6.2. Inferred burst ignition conditions
To constrain the ignition conditions that gave rise to the JEM-X burst, we first determine the local accretion rate per unit area onto the compact object at the time of the event as ṁ = Lpers(1+z)(4πR2(GM/RNS))−1, that is, ṁ ∼ 2 × 10³ g cm−2 s−1 (where the gravitational redshift is 1 + z = 1.259 for a canonical NS with a mass MNS = 1.4M⊙ and a radius of RNS = 11.2 km). We can then estimate the ignition depth at the onset of the burst as
 (4)
(4)
where the nuclear energy Qnuc depends on the mean hydrogen fraction at ignition ⟨X⟩, as Qnuc ∼ 1.35 + 6.05⟨X⟩ MeV/nucleon2 (Goodwin et al. 2019). Once the ignition depth is known, the recurrence time between the bursts can be calculated by using the equation Δtrec = (yign/ṁ)(1+z).
It is not possible to ambiguously estimate yign or Δtrec because the hydrogen fraction, ⟨X⟩, is unknown at ignition (and hence Qnuc) in Eq. (4). In principle, it may be possible to estimate ⟨X⟩ based on the shape of the light curve since it is known to be influenced by the accretion fuel (e.g. Galloway et al. 2008). Instead, we apply a Monte-Carlo approach and estimate yign and Δtrec for a set of randomly generated values of ⟨X⟩ uniformly distributed in the range 0–0.7. Given each pair of (⟨X⟩, Δtrec) we can infer the accreted H-fraction X0, based on the expectation that hydrogen burns via the hot-CNO cycle and will be exhausted in a time tCNO = 9.8(X0/0.7)(ZCNO/0.02)−1 (e.g. Lampe et al. 2016). Since ZCNO is also unknown, we similarly draw random values from a uniform distribution in the range 0.0–0.02. We then apply a cut on the inferred X0 values, requiring X0 < 0.75, and compute the confidence limits on the remaining parameters. The inferred ignition column is  and the average expected recurrence time is 1.8 ± 0.7 d. Such long recurrence times likely guarantee that the hydrogen in the accreted fuel is exhausted at the base prior to ignition, and explaining the fast rise and short duration of the burst. We can also infer lower (upper) limits on X0 (ZCNO), although these limits are not strongly constraining; we find X0 > 0.17 and ZCNO < 0.017 at 95% confidence.
The inferred long recurrence time likely explains the lack of detection of other X-ray bursts during the continuous ∼35 ks XMM-Newton, 27.3, 29.4 ks NuSTAR, and 20 ks Chandra observations, as well as in the segmented NICER observations of 93.4 ks in total, and Swift observations of 17.5 ks in total. Taking all the results together, the type-I X-ray burst fast rise time, the ∼10 s-long plateau at its peak (typical for a PRE episode), the ignition depth, and its related values, we conclude that the JEM-X event was triggered by unstable helium burning after all the accreted hydrogen was exhausted by steady burning prior to the burst.
7. Discussion
When an AMXP undergoes an X-ray outburst, reaching luminosities between 1036 − 37 erg s−1, most of them display very similar behaviours. The outburst lightcurves are typically characterised by a rise lasting for a few days followed by an exponential decay period lasting for a couple of weeks, and concluded by a linear decay down to the quiescence level with a typical duration of a few days (see e.g. Falanga et al. 2005b, 2011, 2012; Ferrigno et al. 2011; De Falco et al. 2017b,a). AMXP outburst profiles are commonly interpreted in terms of the disk instability model, taking into account the irradiation of the disk by the central X-ray source (King & Ritter 1998). The typical AMXP’s outburst profile timescale – from a few weeks to months – and its luminosity are well-fitted within the disk instability picture (Powell et al. 2007).
The outburst profile of IGR J17591−2342 with several reflarings can be explained as follows: During the first 60 days, the mass was supplied onto the neutron star via the accretion disk at a variable mass accretion rate, and after reaching its maximum flux level – around 60 days since the onset of the outburst (near MJD 58379; the last reflare) – the last episode of ∼25 days of the full outburst showed behaviour that was similar to other AMXPs.
Its late-time outburst shape fits nicely within the framework of the disk instability model, that is, the light curve decays exponentially until it reaches a break (“knee”). In our case, this was around MJD 58395.5, after which the flux drops linearly within ∼seven days to the quiescence level (see Figs. 2 and 9).
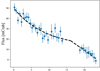 |
Fig. 9. IGR J17591−2342 late-time INTEGRAL-ISGRI (20–60 keV) outburst profile starting from MJD 58379 with a time bin size of 0.5 d. The dashed line corresponds to the best fit in terms of an exponential profile, F ∝ e−t/9d, until the break (“knee”) followed by a linear decay. |
The knee occurs at the lowest value of the X-ray luminosity at which the outer disk edge can still be kept hot by central illuminating source. Following Powell et al. (2007), it is possible to estimate the outer disk radius in two different and independent ways. From the equation LX = (Lt − Le) exp(−(t − tt)/τe)+Le, where Le, tt (the break time), Lt, and τe (exponential decay time) are all free parameters, we determined from the fit to the decay lightcurve (see Fig. 9), the outer disk radius as Rdisk(τe) = (τe 3νKR)1/2 ∼ 3.0 × 1010 cm. For the viscosity near the outer disk edge we adopted the value of νKR = 4 × 1014 cm2 s−1 (see King & Ritter 1998; Powell et al. 2007, for more details).
An independent estimate of Rdisk can also be obtained by using the equation Rdisk(Lt) = (Φ Lt)1/2. If we use Φ ∼ 1.3 × 10⁻¹⁵ cm2 s erg−1 as determined from other AMXPs (Powell et al. 2007), we obtain Rdisk(Lt)∼(5.8 − 7.0) × 1010 cm, for a source distance between 7.0–8.4 kpc (see Sect. 6.1). The estimated Rdisk(Lt) is larger than Rdisk(τe) by a factor of two. At variance to other AMXPs outbursts, for IGR J17591−2342 the exponential and linear outburst decay profile occurred only after ∼60 days after start of the outburst, which may produce a hotter disk and, hence, a smaller value for Φ.
The parameter  depends mainly on the irradiation temperature, Th, at the outer disc radius (King & Ritter 1998). An agreement of the outer disk radius, Rdisk(Lt)∼3.0 × 1010 cm, can be obtained if Φ is reduced by a factor of four. We note that for other systems, such as black hole binaries, the factor Φ is also reduced by factor of ten. This radius also fulfills the condition Rcirc ≲ Rdisk(τe) < b1, where Rcirc ∼ 2.9 × 1010 cm is the circularisation radius and b1 ∼ 1.1 × 1011 cm is the distance of the Lagrange point L1 from the center of the neutron star (see e.g. Frank et al. 2002). To estimate these values, we used a companion star mass of ∼0.9 M⊙, for a neutron star mass of 1.4 M⊙. We note how the Rcirc is close to the outer Rdisk radius for this source.
The observed timing behaviour of IGR J17591−2342 (see Fig. 3) is rather complex: starting with a spin-up episode (MJD 58345–58364), followed by a frequency drop (glitch-like feature; MJD 58364–58370), a period of constant frequency (MJD 58370–58383), and concluding with irregular behaviour beyond (MJD 58383–58408). This behaviour is likely related to varying accretion torques during outburst which are common in persistent disk-fed pulsars (Bildsten et al. 1997). The underlying mechanisms are probably also acting in disk-fed pulsars in transient systems. The structure in the ToA residuals (see Fig. 3) cannot be explained by a bias model containing a bolometric flux dependent term (see e.g. Patruno et al. 2009) which otherwise works well for such instances as the ToA modelling of the 2019 outburst of SAX J1808.4–3658 (see Bult et al. 2020, for a flux-adjusted phase model).
Our detailed pulse profile Fourier decomposition as a function of energy across the 1–50 keV band (see Fig. 6) shows that up to ∼9 keV harder X-ray photons arrive earlier than soft X-ray photons. Above this energy, the lag seems to recover to smaller values. This behaviour bears a strong similarity to the picture observed for IGR J00291+5934, in which a Compton scattering process was proposed to have played an important role in shaping the observed time-lag features (see e.g. Falanga & Titarchuk 2007). Alternatively, the observed evolution of time lags can be explained by different emission pattern of the soft blackbody and hard Comptonised photons (Poutanen & Gierliński 2003).
In this work, we analyse the broad band (0.3–300 keV) time-averaged emission spectrum of IGR J17591−2342, adopting different spectral models among which an absorbed COMPPS model in order to facilitate comparisons with the spectra observed for other AMXPs. We obtain a coherent spectral picture with blackbody seed photon temperature, kTbb, seed, electron temperature, kTe, and Thomson optical depth, τT, that is comparable with values measured for other AMXPs. Moreover, the fitted normalisation provided an emission area radius compatible with the size of a neutron star adopting a distance of 7.6 kpc, as derived in this work from the characteristics of the (single) type-I burst discovered in INTEGRAL-JEM-X data. The size of the emission region would be significantly smaller if the temperature of seed blackbody photons coming from below the Comptonizing slab would be larger (of about 1.5 keV) than the direct seed blackbody coming from a region outside of accretion shock, as has been observed in other AMXPs (e.g. Falanga et al. 2007).
The distance to IGR J17591−2342 derived in this work of 7.6 ± 0.7 kpc puts the source in the Galactic bulge at a Galactic center distance that is consistent with the I-K color value given in Nowak et al. (2019). It also means that the radio-jet of IGR J17591−2342 shines very brightly compared to other neutron star LMXBs, placing it in the LX – LR diagram at parameter space locations that is typically occupied by black-hole LMXBs (see Russell et al. 2018; Gusinskaia et al. 2020). The extreme brightness of radio-jet is unlikely to be due to beaming because of the detection of winds from the system (Nowak et al. 2019).
The total hydrogen column density NH of (2.09 ± 0.05) × 1022 cm−2 derived in this work, however, is considerably lower, but still compatible at a 2σ confidence, compared to the values derived by other groups analysing spectral data of IGR J17591−2342 using a different combination of high-energy instruments (see e.g. Russell et al. 2018; Sanna et al. 2018; Nowak et al. 2019; Gusinskaia et al. 2020). The difference can be explained by the degeneracy between the NH and kTbb, seed fit parameters which become clear through the inclusion of high-quality spectral data from XMM-Newton RGS 1 & 2 and EPIC-MOS2 for energies below ∼1 keV in this work. Moreover, the reconstructed total hydrogen column density in the direction of IGR J17591−2342 is consistent with the total Galactic column density as derived from reddening maps (Russell et al. 2018) and so, there is no need for an intrinsic absorption component near the source.
AMXPs are characterised by an orbital period ranging from ∼38 min (IGR J17062−6143) to ∼11 hrs (IGR J18245−2452); hydrogen-rich main-sequence companion stars for AMXPs with > 3 hrs orbital periods are hosted, as well as with brown dwarfs companion stars with orbital periods between 1–2 h, or ultra-compact helium white dwarfs for orbital periods around 40 minutes (Campana et al. 2018).
All the AMXPs exhibiting type-I X-ray bursts have orbital periods larger than 1 h, that is, those with hydrogen-rich main-sequence or brown dwarf companion stars. However, those with ultra-compact helium white dwarf companions do not exhibit type-I X-ray bursts, except IGR J17062−6143 which showed one long helium burst that can be explained by this source remaining in a faint persistent outburst since 2006. Therefore, the detection of a type-I X-ray burst from IGR J17591−2342 is in perfect agreement with the current picture of type-I X-ray burst occurrence in AMXPs.
8. Summary
In this work, we analyse all available INTEGRAL-ISGRI (20–300 keV) data obtained from INTEGRAL observations performed between Aug. 10–Oct. 11, 2018 (Revs. 1986–2009) together with data from two NuSTAR (3–79 keV) ToO observations, one XMM-Newton (0.3–15 keV) ToO observation, and NICER (0.2–12 keV) monitoring observations to obtain a complete picture of the high-energy emission properties of accretion-powered millisecond X-ray pulsar IGR J17591−2342 during its 2018 outburst in both the timing- and spectral domain. A summary of our findings are given below:
-
(i)
The hard X-ray outburst profile obtained from INTEGRAL -ISGRI 20–60 keV and Swift-BAT 20–50 keV monitoring data shows that IGR J17591−2342 was active for about 85 days from MJD 58320 (July 21, 2018) till MJD 58405 (Oct. 14, 2018). The outburst profile showed multiple re-flarings and during the last re-flaring, we detected in INTEGRAL JEM-X data a bright thermonuclear burst from IGR J17591−2342 on MJD 58380.96358 (MJD TT; Sept. 19, 2018 23:07:33).
-
(ii)
Under the assumption of Eddington luminosity limited PRE burst emission and an anisotropy factor of ξb = 0.71, we estimated the source distance as d = 7.6 ± 0.7 kpc for a He burst.
-
(iii)
From NICER monitoring observations, we updated the orbital parameters of the binary system and subsequently performed pulse a time-of-arrival analysis in order to obtain phase-coherent timing models.
1. We were able to derive the timing parameters ( ) accurately for two time segments across MJD 58345–58405. For segment-1 (MJD 58345–58364), we measured a spin-up rate of
  Hz s−1, indicating a net gain of angular momentum from the accretion flow. During the other segment (#3; MJD 58370-58383) the measurements were consistent with the assumption of a constant spin frequency. Between and beyond these segments, the timing behaviour appeared to be noisy or otherwise erratic.
2. The application of these timing models in pulse-phase folding procedures using NICER, XMM-Newton EPIC-Pn, (corrected) NuSTAR and INTEGRAL-ISGRI data, yielding pulse-phase distributions across the 0.3–300 keV band, shows that pulsed emission had been detected significantly between 1 and 120 keV.
3. The decomposition of the NICER, XMM-Newton EPIC-Pn and NuSTAR pulse-phase distributions across the 1–50 keV band in terms of three harmonics showed that the (background corrected) pulsed fraction of the fundamental component increases from ∼10% to ∼17% when going from ∼1.5 keV to ∼4 keV, beyond which it more or less saturates. The pulsed fraction for the other components is relatively constant: ∼6% and ∼1–2% for the first and second overtone, respectively. The phase-angle as function of energy showed a decreasing trend from ∼1.5 keV till ∼10 keV for both the fundamental and first overtone. This explains that the harder pulsed photons (at 10 keV) arrive ∼95 μs earlier than softer pulsed photons (at 1.5 keV).
-
(iv)
The total broad-band emission spectrum of IGR J17591−2342 using XMM-Newton EPIC-Pn, MOS-2, RGS 1&2, NuSTAR and INTEGRAL-ISGRI data (0.3–150 keV) was fitted adequately with a thermal Comptonisation model (COMPPS) in slab geometry absorbed through an intervening column of NH = (2.09 ± 0.05) × 1022 cm−2. The other best-fit parameters for this model were: a blackbody seed photon temperature kTbb, seed of 0.64 ± 0.02 keV, electron temperature kTe = 38.8 ± 1.2 keV, and Thomson optical depth τT = 1.59 ± 0.04, while the normalisation translated to an emitting radius of 11.3 ± 0.5 km, assuming a distance of 7.6 kpc.
We ignored events with energies smaller than 1.5 keV, because from the XMM-Newton EPIC-pn timing analysis we concluded that the redistribution in the RMF model underestimates the (unexpected, given the high NH in the range (2–5) × 1022 cm−2) measured pulsed signal of 3.2σ in the 0.3–0.5 keV band.
This expression is an update to one previously used in the literature, Qnuc ∼ 1.6 + 4⟨X⟩ MeV/nucleon (e.g. Galloway et al. 2004, and references therein), that arises from overestimating the losses from neutrino emission as given by Fujimoto et al. (1987).
Acknowledgments
This research has made use of data obtained from the High Energy Astrophysics Science Archive Research Center (HEASARC), provided by NASA’s Goddard Space Flight Center. We have extensively used NASA’s Astrophysics Data System (ADS). SST, IAM and JP were supported by the grant 14.W03.31.0021 of the Ministry of Science and Higher Education of the Russian Federation. Z.L. thanks the International Space Science Institute in Bern for the hospitality. Z.L. was supported by National Natural Science Foundation of China (U1938107, 11703021, U1938107, 11873041). We thank dr. P. Bult for useful discussions during the FOXT conference (Oct. 2019) in Amsterdam on possible correlations between the flux and the timing residuals for IGR J17591−2342.
References
- Alpar, M. A., Cheng, A. F., Ruderman, M. A., & Shaham, J. 1982, Nature, 300, 728 [NASA ADS] [CrossRef] [Google Scholar]
- Archibald, A. M., Stairs, I. H., Ransom, S. M., et al. 2009, Science, 324, 1411 [NASA ADS] [CrossRef] [PubMed] [Google Scholar]
- Arnaud, K. A. 1996, in Astronomical Data Analysis Software and Systems V, eds. G. H. Jacoby, & J. Barnes, ASP Conf. Ser., 101, 17 [Google Scholar]
- Arzoumanian, Z., Gendreau, K. C., Baker, C. L., et al. 2014, in Space Telescopes and Instrumentation 2014: Ultraviolet to Gamma Ray, SPIE Conf. Ser., 9144, 914420 [Google Scholar]
- Bassa, C. G., Patruno, A., Hessels, J. W. T., et al. 2014, MNRAS, 441, 1825 [Google Scholar]
- Bildsten, L., Chakrabarty, D., Chiu, J., et al. 1997, ApJS, 113, 367 [NASA ADS] [CrossRef] [Google Scholar]
- Bozzo, E., Ferrigno, C., Falanga, M., et al. 2010, A&A, 509, L3 [NASA ADS] [CrossRef] [EDP Sciences] [Google Scholar]
- Bozzo, E., Ducci, L., Ferrigno, C., et al. 2018, ATel, 11942, 1 [NASA ADS] [Google Scholar]
- Buccheri, R., Bennett, K., Bignami, G. F., et al. 1983, A&A, 128, 245 [NASA ADS] [Google Scholar]
- Bult, P., Chakrabarty, D., Arzoumanian, Z., et al. 2020, ApJ, 898, 38 [CrossRef] [Google Scholar]
- Campana, S., & Di Salvo, T. 2018, in Astrophysics and Space Science Library, eds. L. Rezzolla, P. Pizzochero, D. I. Jones, N. Rea, & I. Vidaña, Astrophys. Space Sci. Lib., 457, 149 [NASA ADS] [CrossRef] [Google Scholar]
- Chenevez, J., Jaisawal, G., Kuulkers, E., et al. 2018, ATel, 11952 [Google Scholar]
- Courvoisier, T. J. L., Walter, R., Beckmann, V., et al. 2003, A&A, 411, L53 [NASA ADS] [CrossRef] [EDP Sciences] [Google Scholar]
- De Falco, V., Kuiper, L., Bozzo, E., et al. 2017a, A&A, 603, A16 [NASA ADS] [CrossRef] [EDP Sciences] [Google Scholar]
- De Falco, V., Kuiper, L., Bozzo, E., et al. 2017b, A&A, 599, A88 [NASA ADS] [CrossRef] [EDP Sciences] [Google Scholar]
- de Martino, D., Falanga, M., Bonnet-Bidaud, J.-M., et al. 2010, A&A, 515, A25 [NASA ADS] [CrossRef] [EDP Sciences] [Google Scholar]
- den Herder, J. W., Brinkman, A. C., Kahn, S. M., et al. 2001, A&A, 365, L7 [NASA ADS] [CrossRef] [EDP Sciences] [Google Scholar]
- Dickey, J. M., & Lockman, F. J. 1990, ARA&A, 28, 215 [NASA ADS] [CrossRef] [MathSciNet] [Google Scholar]
- Ducci, L., Kuulkers, E., Grinberg, V., et al. 2018, ATel, 11941, 1 [NASA ADS] [Google Scholar]
- Falanga, M., & Titarchuk, L. 2007, ApJ, 661, 1084 [NASA ADS] [CrossRef] [Google Scholar]
- Falanga, M., Bonnet-Bidaud, J. M., Poutanen, J., et al. 2005a, A&A, 436, 647 [NASA ADS] [CrossRef] [EDP Sciences] [Google Scholar]
- Falanga, M., Kuiper, L., Poutanen, J., et al. 2005b, A&A, 444, 15 [NASA ADS] [CrossRef] [EDP Sciences] [Google Scholar]
- Falanga, M., Poutanen, J., Bonning, E. W., et al. 2007, A&A, 464, 1069 [NASA ADS] [CrossRef] [EDP Sciences] [Google Scholar]
- Falanga, M., Kuiper, L., Poutanen, J., et al. 2011, A&A, 529, A68 [NASA ADS] [CrossRef] [EDP Sciences] [Google Scholar]
- Falanga, M., Kuiper, L., Poutanen, J., et al. 2012, A&A, 545, A26 [NASA ADS] [CrossRef] [EDP Sciences] [Google Scholar]
- Ferrigno, C., Bozzo, E., Falanga, M., et al. 2011, A&A, 525, A48 [NASA ADS] [CrossRef] [EDP Sciences] [Google Scholar]
- Ferrigno, C., Bozzo, W., Sanna, A., et al. 2018, ATel, 11957, 1 [NASA ADS] [Google Scholar]
- Frank, J., King, A., & Raine, D. J. 2002, Accretion Power in Astrophysics: Third Edition (Cambridge, UK: Cambridge University Press), 398 [Google Scholar]
- Fujimoto, M. Y. 1988, ApJ, 324, 995 [NASA ADS] [CrossRef] [Google Scholar]
- Fujimoto, M. Y., Sztajno, M., Lewin, W. H. G., & van Paradijs, J. 1987, ApJ, 319, 902 [CrossRef] [Google Scholar]
- Galloway, D. K., Cumming, A., Kuulkers, E., et al. 2004, ApJ, 601, 466 [NASA ADS] [CrossRef] [Google Scholar]
- Galloway, D. K., Muno, M. P., Hartman, J. M., Psaltis, D., & Chakrabarty, D. 2008, ApJS, 179, 360 [NASA ADS] [CrossRef] [Google Scholar]
- Gierliński, M., & Poutanen, J. 2005, MNRAS, 359, 1261 [NASA ADS] [CrossRef] [Google Scholar]
- Gierliński, M., Done, C., & Barret, D. 2002, MNRAS, 331, 141 [NASA ADS] [CrossRef] [Google Scholar]
- Goldwurm, A., David, P., Foschini, L., et al. 2003, A&A, 411, L223 [NASA ADS] [CrossRef] [EDP Sciences] [Google Scholar]
- Goodwin, A. J., Heger, A., & Galloway, D. K. 2019, ApJ, 870, 64 [NASA ADS] [CrossRef] [Google Scholar]
- Gotthelf, E. V., & Bogdanov, S. 2017, ApJ, 845, 159 [NASA ADS] [CrossRef] [Google Scholar]
- Gusinskaia, N. V., Russell, T. D., Hessels, J. W. T., et al. 2020, MNRAS, 492, 1091 [CrossRef] [Google Scholar]
- Harrison, F. A., Craig, W. W., Christensen, F. E., et al. 2013, ApJ, 770, 103 [NASA ADS] [CrossRef] [Google Scholar]
- Hartman, J. M., Patruno, A., Chakrabarty, D., et al. 2008, ApJ, 675, 1468 [NASA ADS] [CrossRef] [Google Scholar]
- He, C.-C., & Keek, L. 2016, ApJ, 819, 47 [NASA ADS] [CrossRef] [Google Scholar]
- Ibragimov, A., & Poutanen, J. 2009, MNRAS, 400, 492 [NASA ADS] [CrossRef] [Google Scholar]
- in ’t Zand, J. J. M., Heise, J., Muller, J. M., et al. 1998, A&A, 331, L25 [Google Scholar]
- Kaastra, J. S., & Bleeker, J. A. M. 2016, A&A, 587, A151 [NASA ADS] [CrossRef] [EDP Sciences] [Google Scholar]
- Kalberla, P. M. W., Burton, W. B., Hartmann, D., et al. 2005, A&A, 440, 775 [NASA ADS] [CrossRef] [EDP Sciences] [Google Scholar]
- King, A. R., & Ritter, H. 1998, MNRAS, 293, L42 [NASA ADS] [CrossRef] [Google Scholar]
- Krimm, H. A., Holland, S. T., Corbet, R. H. D., et al. 2013, ApJS, 209, 14 [NASA ADS] [CrossRef] [Google Scholar]
- Krimm, H. A., Barthelmy, S. D., Cummings, J. R., et al. 2018, ATel, 11981, 1 [NASA ADS] [Google Scholar]
- Kuiper, L., & Hermsen, W. 2009, A&A, 501, 1031 [NASA ADS] [CrossRef] [EDP Sciences] [Google Scholar]
- Kuiper, L., Tsygankov, S., Falanga, M., et al. 2018, ATel, 12004, 1 [NASA ADS] [Google Scholar]
- Kuulkers, E., den Hartog, P. R., in’t Zand, J. J. M., et al. 2003, A&A, 399, 663 [NASA ADS] [CrossRef] [EDP Sciences] [Google Scholar]
- Lampe, N., Heger, A., & Galloway, D. K. 2016, ApJ, 819, 46 [NASA ADS] [CrossRef] [Google Scholar]
- Lebrun, F., Leray, J. P., Lavocat, P., et al. 2003, A&A, 411, L141 [NASA ADS] [CrossRef] [EDP Sciences] [Google Scholar]
- Lewin, W. H. G., van Paradijs, J., & Taam, R. E. 1993, Space Sci. Rev., 62, 223 [NASA ADS] [CrossRef] [Google Scholar]
- Li, Z., De Falco, V., Falanga, M., et al. 2018, A&A, 620, A114 [NASA ADS] [CrossRef] [EDP Sciences] [Google Scholar]
- Linares, M., van der Klis, M., Altamirano, D., & Markwardt, C. B. 2005, ApJ, 634, 1250 [NASA ADS] [CrossRef] [Google Scholar]
- Lund, N., Budtz-Jørgensen, C., Westergaard, N. J., et al. 2003, A&A, 411, L231 [NASA ADS] [CrossRef] [EDP Sciences] [Google Scholar]
- Madsen, K. K., Harrison, F. A., Markwardt, C. B., et al. 2015, ApJS, 220, 8 [NASA ADS] [CrossRef] [Google Scholar]
- Mereminskiy, I. A., Grebenev, S. A., & Sunyaev, R. A. 2017, Astron. Lett., 43, 656 [NASA ADS] [CrossRef] [Google Scholar]
- Nowak, M., Paizis, A., Chenevez, J., et al. 2018, ATel, 11988, 1 [NASA ADS] [Google Scholar]
- Nowak, M. A., Paizis, A., Jaisawal, G. K., et al. 2019, ApJ, 874, 69 [NASA ADS] [CrossRef] [Google Scholar]
- Papitto, A., Ferrigno, C., Bozzo, E., et al. 2013, Nature, 501, 517 [NASA ADS] [CrossRef] [PubMed] [Google Scholar]
- Parikh, A. S., & Wijnands, R. 2019, ATel, 12831, 1 [NASA ADS] [Google Scholar]
- Patruno, A., & Watts, A. L. 2012, ArXiv e-prints [arXiv:1206.2727] [Google Scholar]
- Patruno, A., Wijnands, R., & van der Klis, M. 2009, ApJ, 698, L60 [NASA ADS] [CrossRef] [Google Scholar]
- Poutanen, J., & Gierliński, M. 2003, MNRAS, 343, 1301 [NASA ADS] [CrossRef] [Google Scholar]
- Poutanen, J., & Svensson, R. 1996, ApJ, 470, 249 [NASA ADS] [CrossRef] [Google Scholar]
- Powell, C. R., Haswell, C. A., & Falanga, M. 2007, MNRAS, 374, 466 [NASA ADS] [CrossRef] [Google Scholar]
- Radhakrishnan, V., & Srinivasan, G. 1982, Curr. Sci., 51, 1096 [NASA ADS] [Google Scholar]
- Roy, J., Ray, P. S., Bhattacharyya, B., et al. 2015, ApJ, 800, L12 [Google Scholar]
- Russell, T. D., Degenaar, N., Wijnands, R., et al. 2018, ApJ, 869, L16 [Google Scholar]
- Sanna, A., Ferrigno, C., Ray, P. S., et al. 2018, A&A, 617, L8 [NASA ADS] [CrossRef] [EDP Sciences] [Google Scholar]
- Shaw, A. W., & Degenaar, N. 2018, ATel, 11970 [Google Scholar]
- Stappers, B. W., Archibald, A. M., Hessels, J. W. T., et al. 2014, ApJ, 790, 39 [Google Scholar]
- Strohmayer, T., & Bildsten, L. 2006, in Compact stellar X-ray sources, eds. W. Lewin, & M. van der Klis (Cambridge: Cambridge University Press), Cambridge Astrophys. Ser., 39, 113 [Google Scholar]
- Strüder, L., Briel, U., Dennerl, K., et al. 2001, A&A, 365, L18 [NASA ADS] [CrossRef] [EDP Sciences] [Google Scholar]
- Turner, M. J. L., Abbey, A., Arnaud, M., et al. 2001, A&A, 365, L27 [NASA ADS] [CrossRef] [EDP Sciences] [Google Scholar]
- Ubertini, P., Lebrun, F., Di Cocco, G., et al. 2003, A&A, 411, L131 [NASA ADS] [CrossRef] [EDP Sciences] [Google Scholar]
- Vedrenne, G., Roques, J.-P., Schönfelder, V., et al. 2003, A&A, 411, L63 [NASA ADS] [CrossRef] [EDP Sciences] [Google Scholar]
- Šimon, V. 2018, MNRAS, 477, 67 [Google Scholar]
- Wijnands, R. 2006, in Trends in Pulsar Research, ed. J. A. Lowry (New York, NY USA: Nova Science Publishers Inc.), 53 [Google Scholar]
- Winkler, C., Courvoisier, T. J.-L., Di Cocco, G., et al. 2003, A&A, 411, L1 [NASA ADS] [CrossRef] [EDP Sciences] [Google Scholar]
- Zdziarski, A. A., Johnson, W. N., & Magdziarz, P. 1996, MNRAS, 283, 193 [NASA ADS] [CrossRef] [Google Scholar]
- Życki, P. T., Done, C., & Smith, D. A. 1999, MNRAS, 309, 561 [NASA ADS] [CrossRef] [Google Scholar]
All Tables
Positional, orbital, and rotational parameters derived in this work (or fixed to literature values) for IGR J17591−2342.
Best parameters determined from the fits to the total broad-band emission spectrum of IGR J17591−2342 performed with the XMM-Newton, NuSTAR and INTEGRAL using the PHABS absorbed comptonisation models NTHCOMP or COMPPS, respectively.
Parameters of the type-I X-ray burst observed by INTEGRAL JEM-X during the outburst of IGR J17591−2342 in 2018.
All Figures
|
Fig. 1. INTEGRAL ISGRI 20–60 keV significance map in Galactic coordinates for Rev-1986 (MJD 58340.661-58341.806) of the sky region showing the new hard X-ray transient IGR J17591−2342, indicated by an arrow near (l, b) = (6,0), at a significance of ∼13.8σ. Other detected hard X-ray sources during this period are indicated as well among them, IGR J17503−2636, which was detected for the first time in JEM-X data during the Galactic bulge observations of Rev-1986 (Chenevez et al. 2018). |
| In the text | |
|
Fig. 2. Hard X-ray outburst profile of IGR J17591−2342 for the 20–60 keV band (INTEGRAL ISGRI; black data points). The flux is expressed in mCrab. Swift-BAT measurements for the 15–50 keV band are superposed (blue colored triangles; expressed in mCrab units as well). The onset of the 2018-outburst of IGR J17591−2342 starts around MJD 58320 and ends at MJD 58405, lasting for about 85 days. Multiple flares are visible, and during the one that reached maximum luminosity we detected a bright burst at the end of INTEGRAL Rev-2001, indicated by green arrows/line. The orange colored bands indicate the time intervals of the two NuSTAR ToO observations, while the red and cyan bands do so for the XMM-Newton and Chandra ToO’s, respectively. At the top of the panel the timeline of the INTEGRAL ISGRI Galactic Center observations are denoted by their corresponding revolution identifier. The onset of the outburst near MJD 58320, 20 days before the actual discovery of IGR J17591−2342 by INTEGRAL, as identified in Swift-BAT data (Krimm et al. 2018), is indicated as well. |
| In the text | |
|
Fig. 3. Bottom panel: timing residuals of all NICER IGR J17591−2342 pulse template arrival times (in phase units) with respect to the best phase-coherent model (=constant frequency; see Table 1 ) for segment-3, which covers MJD 58370–58383 (green band/data points). Deterministic (segment-1, covering MJD 58345–58364, blue band/data points) as well as more noisy/erratic segments (e.g. segment-2 from MJD 58364–58370 and segment-4 for data beyond MJD 58383) are shown too. In orange, yellow and red the two NuSTAR, Chandra and XMM-Newton ToO’s are indicated, respectively. Top panel: data points and dashed line show the shape of the NICER 1–10 keV daily averaged count rate. |
| In the text | |
|
Fig. 4. NICER pulse profiles of IGR J17591−2342, using data collected during segment-1 (MJD 58345–58364), for three different energy bands: 1–3 keV (including truncated Fourier series fit with three harmonics: black), 3–5 keV (orange), and 5–10 keV (red). The shift towards earlier phases of the higher energy profiles is evident. |
| In the text | |
|
Fig. 5. High-energy pulse profiles as function of energy for IGR J17591−2342 using NICER (MJD 58345–58364; segment-1), XMM-Newton, NuSTAR (MJD 58344; ToO-I), and INTEGRAL ISGRI (Revs. 1986–2006) data covering the 1–120 keV energy band. Pulsed emission has been detected significantly up to ∼120 keV. |
| In the text | |
|
Fig. 6. Left: fractional amplitude of various harmonics (1 – fundamental, 2 – first overtone, and 3 – second overtone) as a function of energy using background corrected data from XMM-Newton EPIC-pn (circles), NICER (squares) and NuSTAR (triangles). The pulsed fraction of the fundamental component increases from ∼10% till ∼17% from 1.5 to 3–4 keV, from where it more or less saturates at a level of ∼17%. Right: phase-angle as function of energy for the three Fourier components. The shift towards lower phases from ∼1.5 keV till ∼10 keV for both the fundamental and first overtone is evident. |
| In the text | |
|
Fig. 7. Unfolded absorbed broad-band spectrum of IGR J17591−2342 in the 0.3–150 keV energy range (left panel). The data points are obtained from the two XMM-Newton RGS instruments (yellow and magenta datapoints, ∼0.33–2.1 keV), XMM-Newton EPIC-pn (green points, 1.5–12 keV), XMM-Newton EPIC-MOS2 (cyan points, 0.5–10 keV), NuSTAR FPMA/FPMB (red and blue points, 3.5–80 keV), and INTEGRAL-ISGRI (black points, 30–150 keV). The fit is obtained with the COMPPS model, represented in the top panel with a solid black line. The residuals from the best fit are shown at the bottom. The right-hand panel shows the correlation between NH and kTBB in the COMPPS model: two minima co-exist. The contours encompassing the minima denote the 1, 2, and 3σ confidence levels assuming 2 degrees of freedom (DOF), while the others are labeled with their corresponding χ2-value (note: the DOF is 910). |
| In the text | |
|
Fig. 8. Light curve of the type-I X-ray burst detected by JEM-X and reported for the first time in this paper. The burst start time was 58380.96358 MJD. The JEM-X light curve was extracted in the 5–25 keV energy range with a time bin of 2 s. |
| In the text | |
|
Fig. 9. IGR J17591−2342 late-time INTEGRAL-ISGRI (20–60 keV) outburst profile starting from MJD 58379 with a time bin size of 0.5 d. The dashed line corresponds to the best fit in terms of an exponential profile, F ∝ e−t/9d, until the break (“knee”) followed by a linear decay. |
| In the text | |
Current usage metrics show cumulative count of Article Views (full-text article views including HTML views, PDF and ePub downloads, according to the available data) and Abstracts Views on Vision4Press platform.
Data correspond to usage on the plateform after 2015. The current usage metrics is available 48-96 hours after online publication and is updated daily on week days.
Initial download of the metrics may take a while.