Fig. 2.
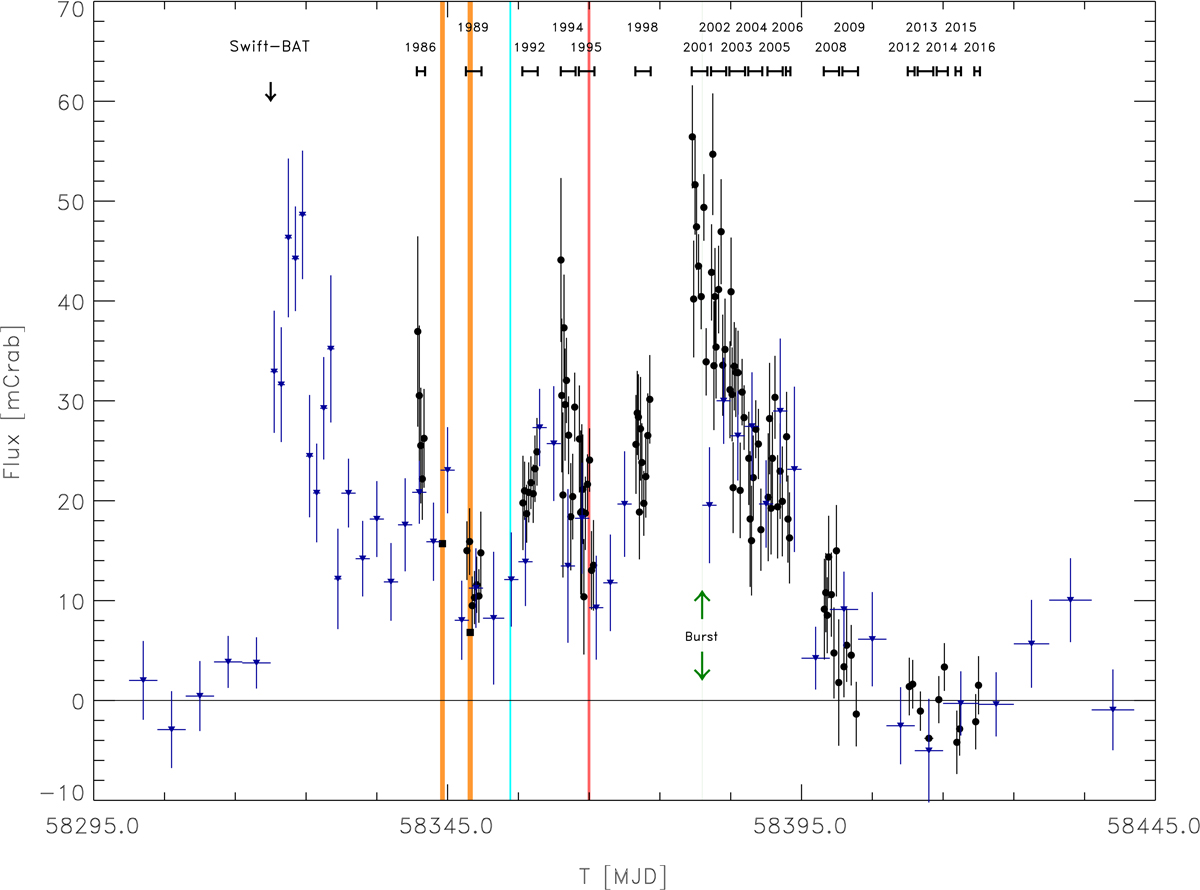
Hard X-ray outburst profile of IGR J17591−2342 for the 20–60 keV band (INTEGRAL ISGRI; black data points). The flux is expressed in mCrab. Swift-BAT measurements for the 15–50 keV band are superposed (blue colored triangles; expressed in mCrab units as well). The onset of the 2018-outburst of IGR J17591−2342 starts around MJD 58320 and ends at MJD 58405, lasting for about 85 days. Multiple flares are visible, and during the one that reached maximum luminosity we detected a bright burst at the end of INTEGRAL Rev-2001, indicated by green arrows/line. The orange colored bands indicate the time intervals of the two NuSTAR ToO observations, while the red and cyan bands do so for the XMM-Newton and Chandra ToO’s, respectively. At the top of the panel the timeline of the INTEGRAL ISGRI Galactic Center observations are denoted by their corresponding revolution identifier. The onset of the outburst near MJD 58320, 20 days before the actual discovery of IGR J17591−2342 by INTEGRAL, as identified in Swift-BAT data (Krimm et al. 2018), is indicated as well.
Current usage metrics show cumulative count of Article Views (full-text article views including HTML views, PDF and ePub downloads, according to the available data) and Abstracts Views on Vision4Press platform.
Data correspond to usage on the plateform after 2015. The current usage metrics is available 48-96 hours after online publication and is updated daily on week days.
Initial download of the metrics may take a while.