Fig. 7.
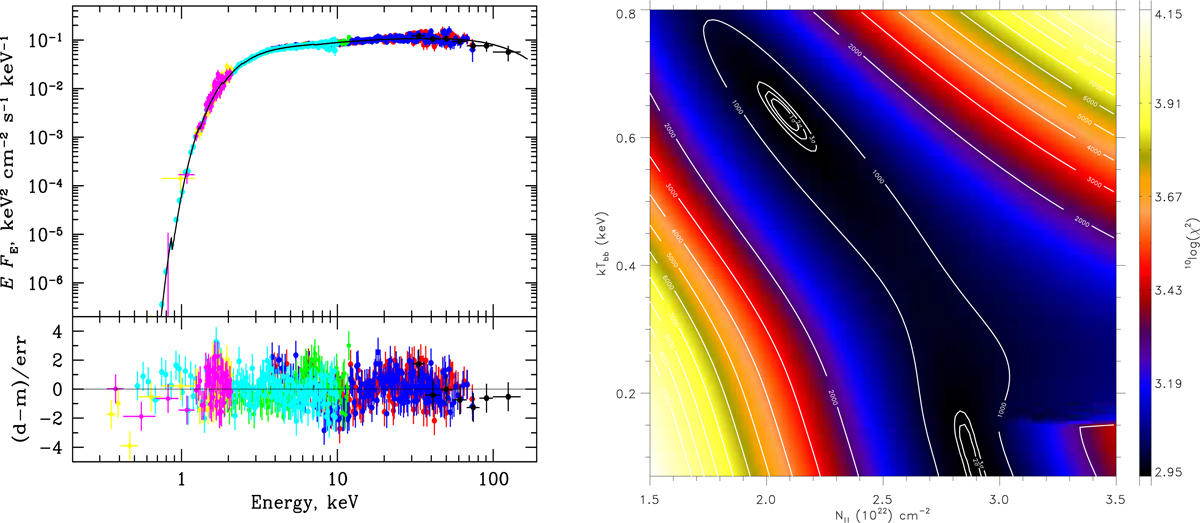
Unfolded absorbed broad-band spectrum of IGR J17591−2342 in the 0.3–150 keV energy range (left panel). The data points are obtained from the two XMM-Newton RGS instruments (yellow and magenta datapoints, ∼0.33–2.1 keV), XMM-Newton EPIC-pn (green points, 1.5–12 keV), XMM-Newton EPIC-MOS2 (cyan points, 0.5–10 keV), NuSTAR FPMA/FPMB (red and blue points, 3.5–80 keV), and INTEGRAL-ISGRI (black points, 30–150 keV). The fit is obtained with the COMPPS model, represented in the top panel with a solid black line. The residuals from the best fit are shown at the bottom. The right-hand panel shows the correlation between NH and kTBB in the COMPPS model: two minima co-exist. The contours encompassing the minima denote the 1, 2, and 3σ confidence levels assuming 2 degrees of freedom (DOF), while the others are labeled with their corresponding χ2-value (note: the DOF is 910).
Current usage metrics show cumulative count of Article Views (full-text article views including HTML views, PDF and ePub downloads, according to the available data) and Abstracts Views on Vision4Press platform.
Data correspond to usage on the plateform after 2015. The current usage metrics is available 48-96 hours after online publication and is updated daily on week days.
Initial download of the metrics may take a while.