Fig. 5.
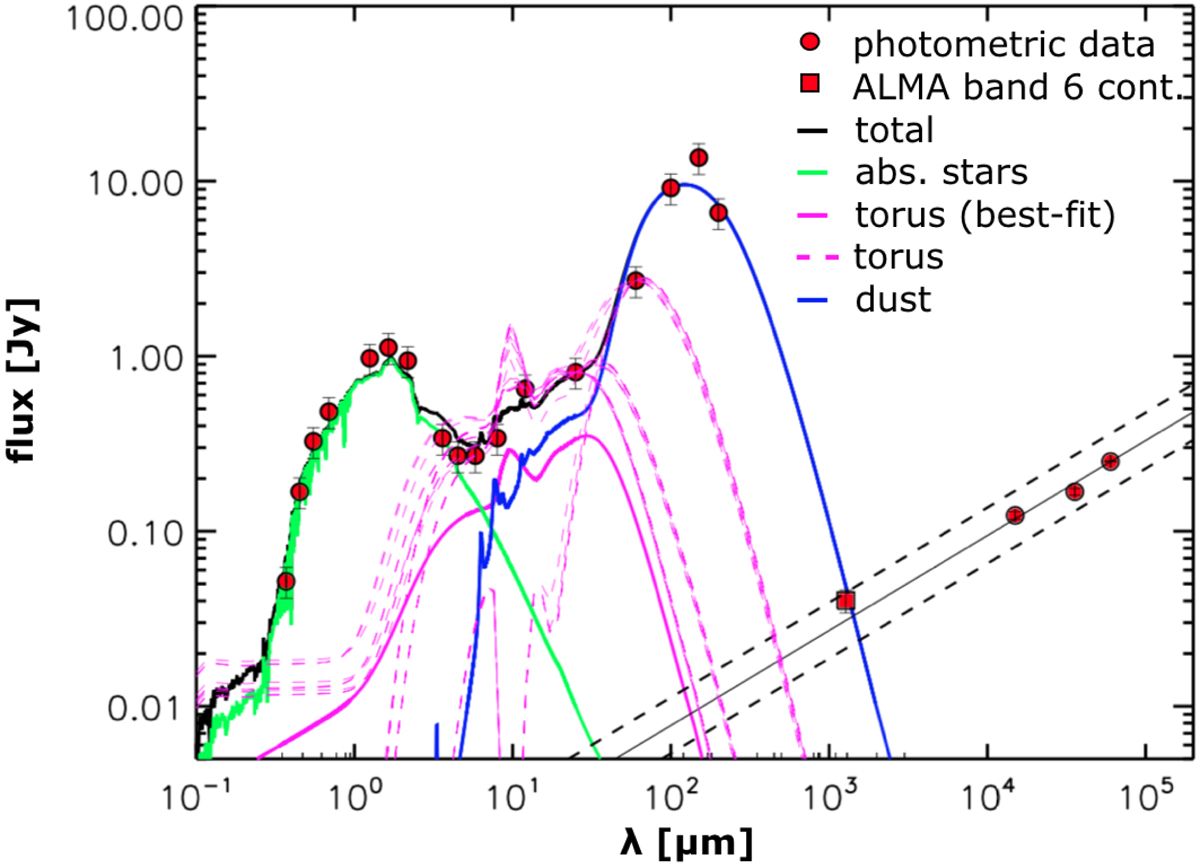
Decomposed SED of NGC 7213, obtained with the SED3FIT code (Berta et al. 2013). Green, pink (continuous line), and blue lines represent the contribution from the extinguished stars, the dusty torus, and the emission reprocessed by dust, respectively, while the black solid curve is the sum of all components (total emission). The red circles are the photometric measurements, from the optical to the radio frequencies (i.e. the ATCA observations at 5, 8, and 20 GHz, not included in the SED decomposition). As explained in Sect. 3.4, the nature of this emission (represented by the red square) is compatible with non-thermal emission produced in the nuclear region, i.e. synchrotron emission. Even considering extreme models (the pink dashed lines), the dusty torus cannot be responsible for the observed emission (red square), since it would be too faint at mm wavelengths (at least two orders of magnitudes fainter). Then, we fitted the three radio-frequency observations by ATCA with a power law, obtaining the best-fit slope represented by the black solid line (the dashed lines correspond to the 1-σ levels).
Current usage metrics show cumulative count of Article Views (full-text article views including HTML views, PDF and ePub downloads, according to the available data) and Abstracts Views on Vision4Press platform.
Data correspond to usage on the plateform after 2015. The current usage metrics is available 48-96 hours after online publication and is updated daily on week days.
Initial download of the metrics may take a while.