Fig. 4.
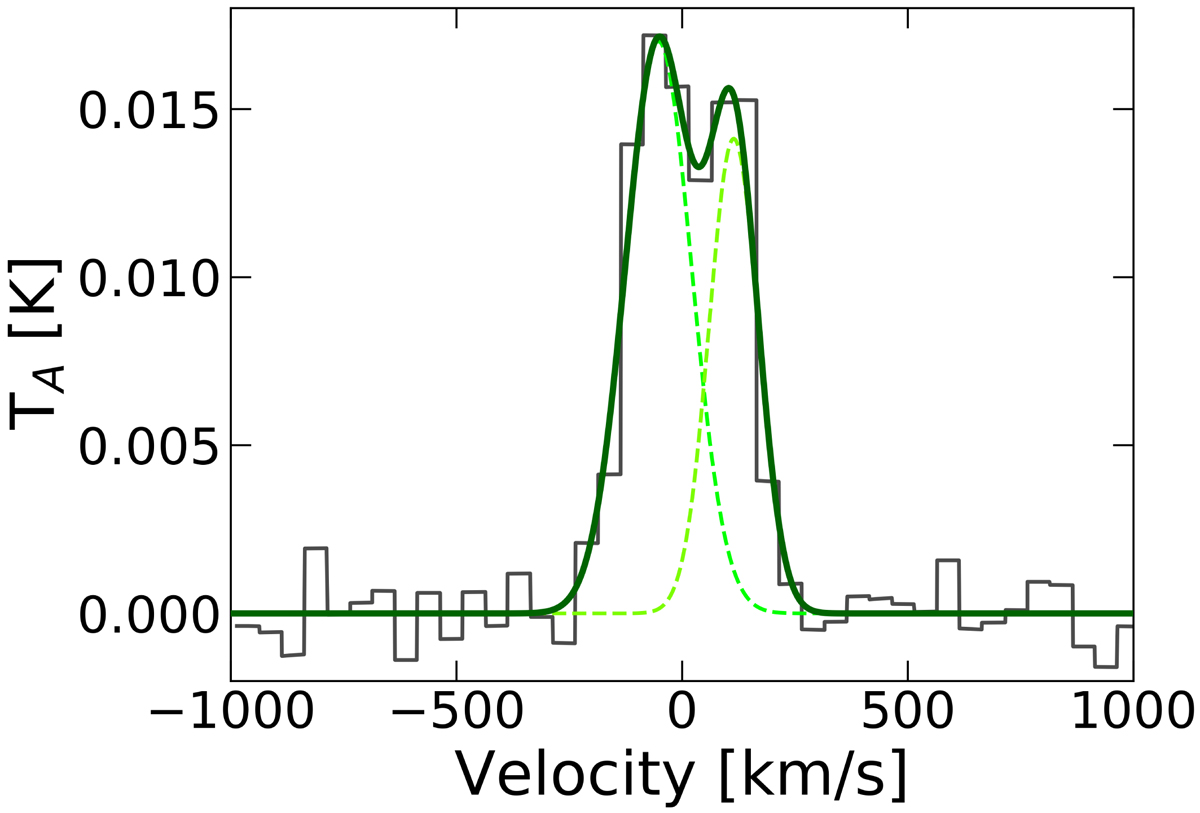
CO(2–1) emission line observed with the PI230 receiver at APEX. On the x-axis, the velocity in km s−1, on the y-axis the antenna temperature in K; the channel width is Δv = 50 km s−1. Two Gaussian functions (in dashed light green lines, while the sum of the two is in dark green) are needed to reproduce the double-peak spectrum profile (in black). A rotation-dominated kinematics is suggested by the double-peaked line profile.
Current usage metrics show cumulative count of Article Views (full-text article views including HTML views, PDF and ePub downloads, according to the available data) and Abstracts Views on Vision4Press platform.
Data correspond to usage on the plateform after 2015. The current usage metrics is available 48-96 hours after online publication and is updated daily on week days.
Initial download of the metrics may take a while.