Free Access
Fig. 3.
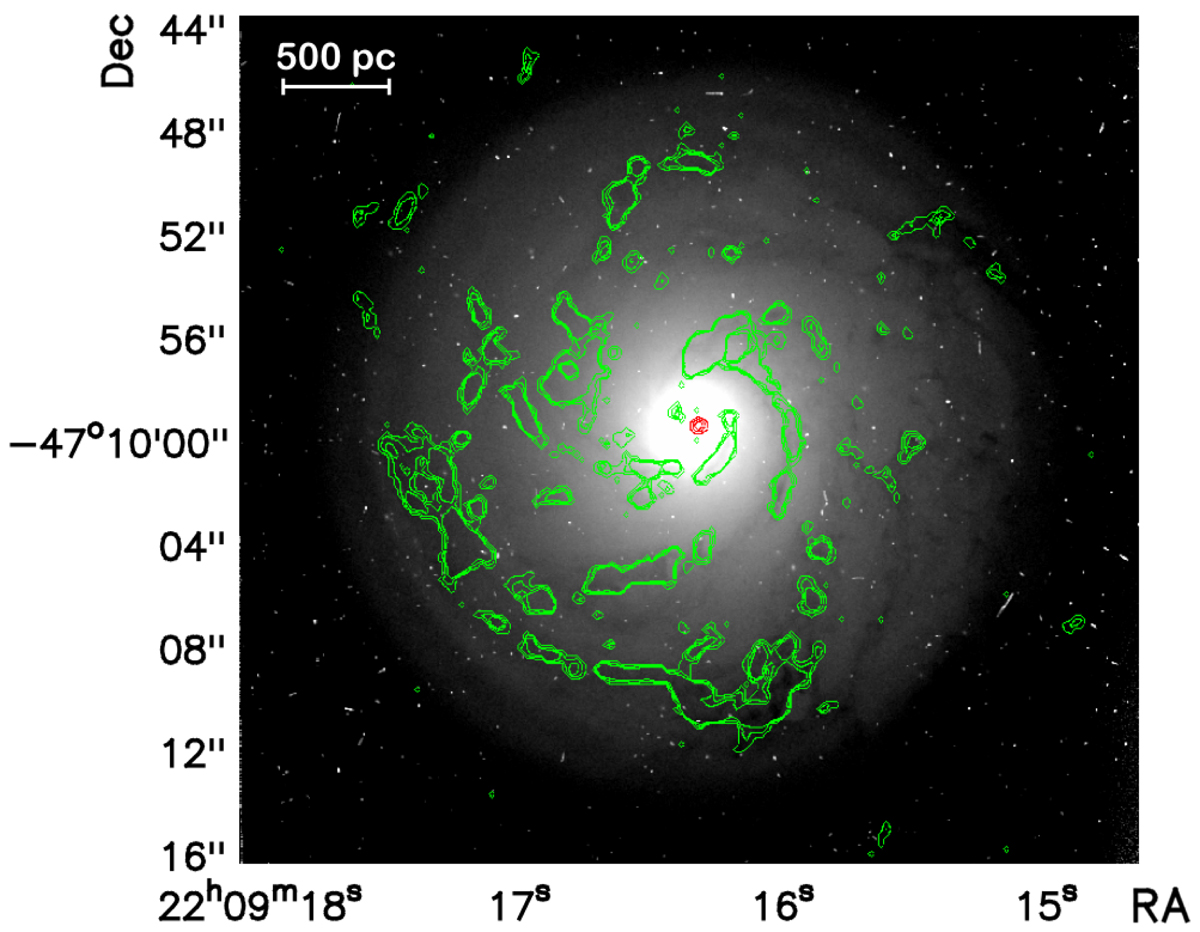
Contour levels of continuum (red) and CO(2–1) line emission (green, at 2σ, 4σ, and 6σ levels) are superimposed on an optical image from the Hubble Space Telescope (HST; F606W filter). The molecular gas follows the same spiral-like pattern as the optical emission. The continuum is produced by a point-like source.
Current usage metrics show cumulative count of Article Views (full-text article views including HTML views, PDF and ePub downloads, according to the available data) and Abstracts Views on Vision4Press platform.
Data correspond to usage on the plateform after 2015. The current usage metrics is available 48-96 hours after online publication and is updated daily on week days.
Initial download of the metrics may take a while.