Fig. 2.
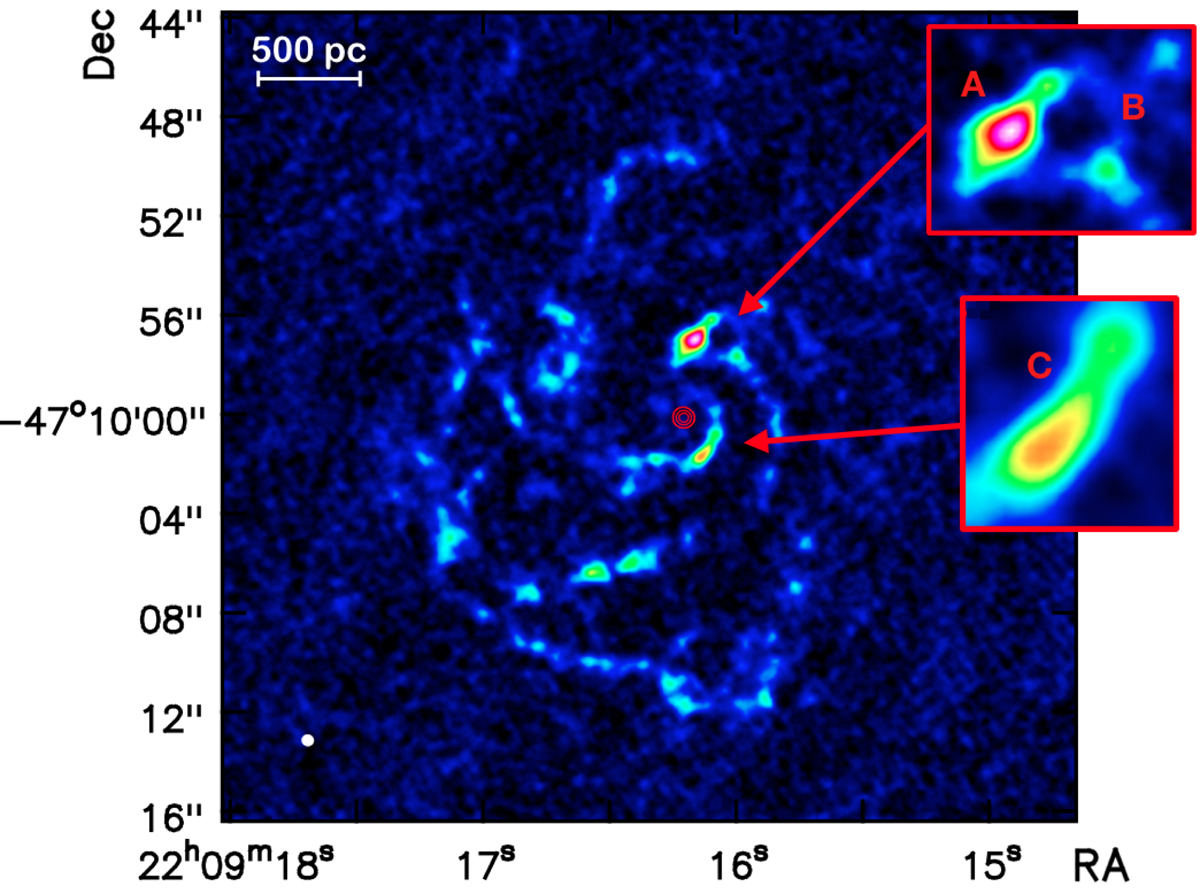
ALMA CO(2–1) integrated intensity image with the continuum emission overlaid in red contours (at 5σ, 10σ, and 50σ levels). The white ellipse in the bottom-left corner represents the synthesised beam of 0.50″ × 0.47″ with a position angle of 73.4 deg. The three interesting regions are magnified in the two boxes: a possible outflow (A) located at the edge of a super bubble (B) and a second potential outflow observed from the PV diagram analysis (C; see Fig. 7).
Current usage metrics show cumulative count of Article Views (full-text article views including HTML views, PDF and ePub downloads, according to the available data) and Abstracts Views on Vision4Press platform.
Data correspond to usage on the plateform after 2015. The current usage metrics is available 48-96 hours after online publication and is updated daily on week days.
Initial download of the metrics may take a while.