Free Access
Fig. 13.
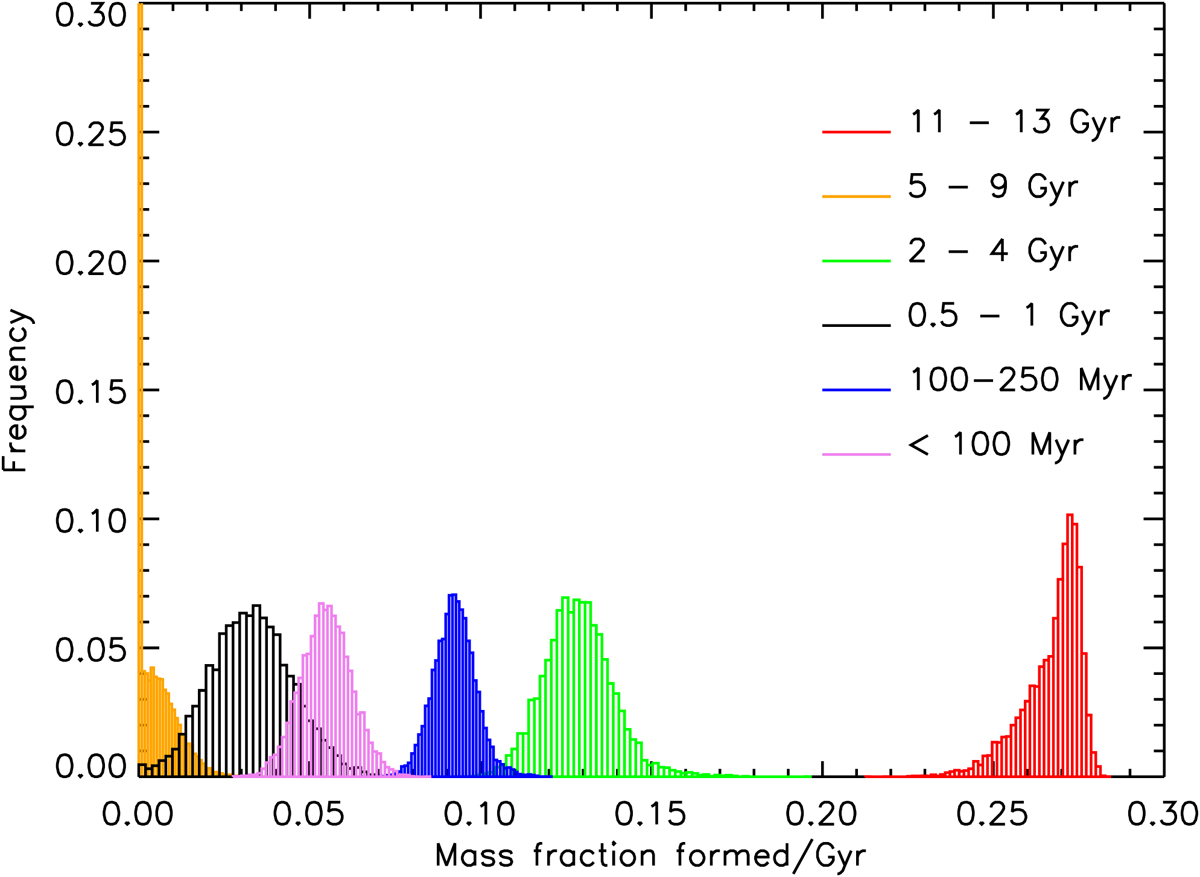
Relative star formation rate in the NSC as a function of time. Histograms corresponding to the SFH from the lower panel of Fig. 11 divided by the approximate length of the corresponding time intervals.
Current usage metrics show cumulative count of Article Views (full-text article views including HTML views, PDF and ePub downloads, according to the available data) and Abstracts Views on Vision4Press platform.
Data correspond to usage on the plateform after 2015. The current usage metrics is available 48-96 hours after online publication and is updated daily on week days.
Initial download of the metrics may take a while.