Fig. 3.
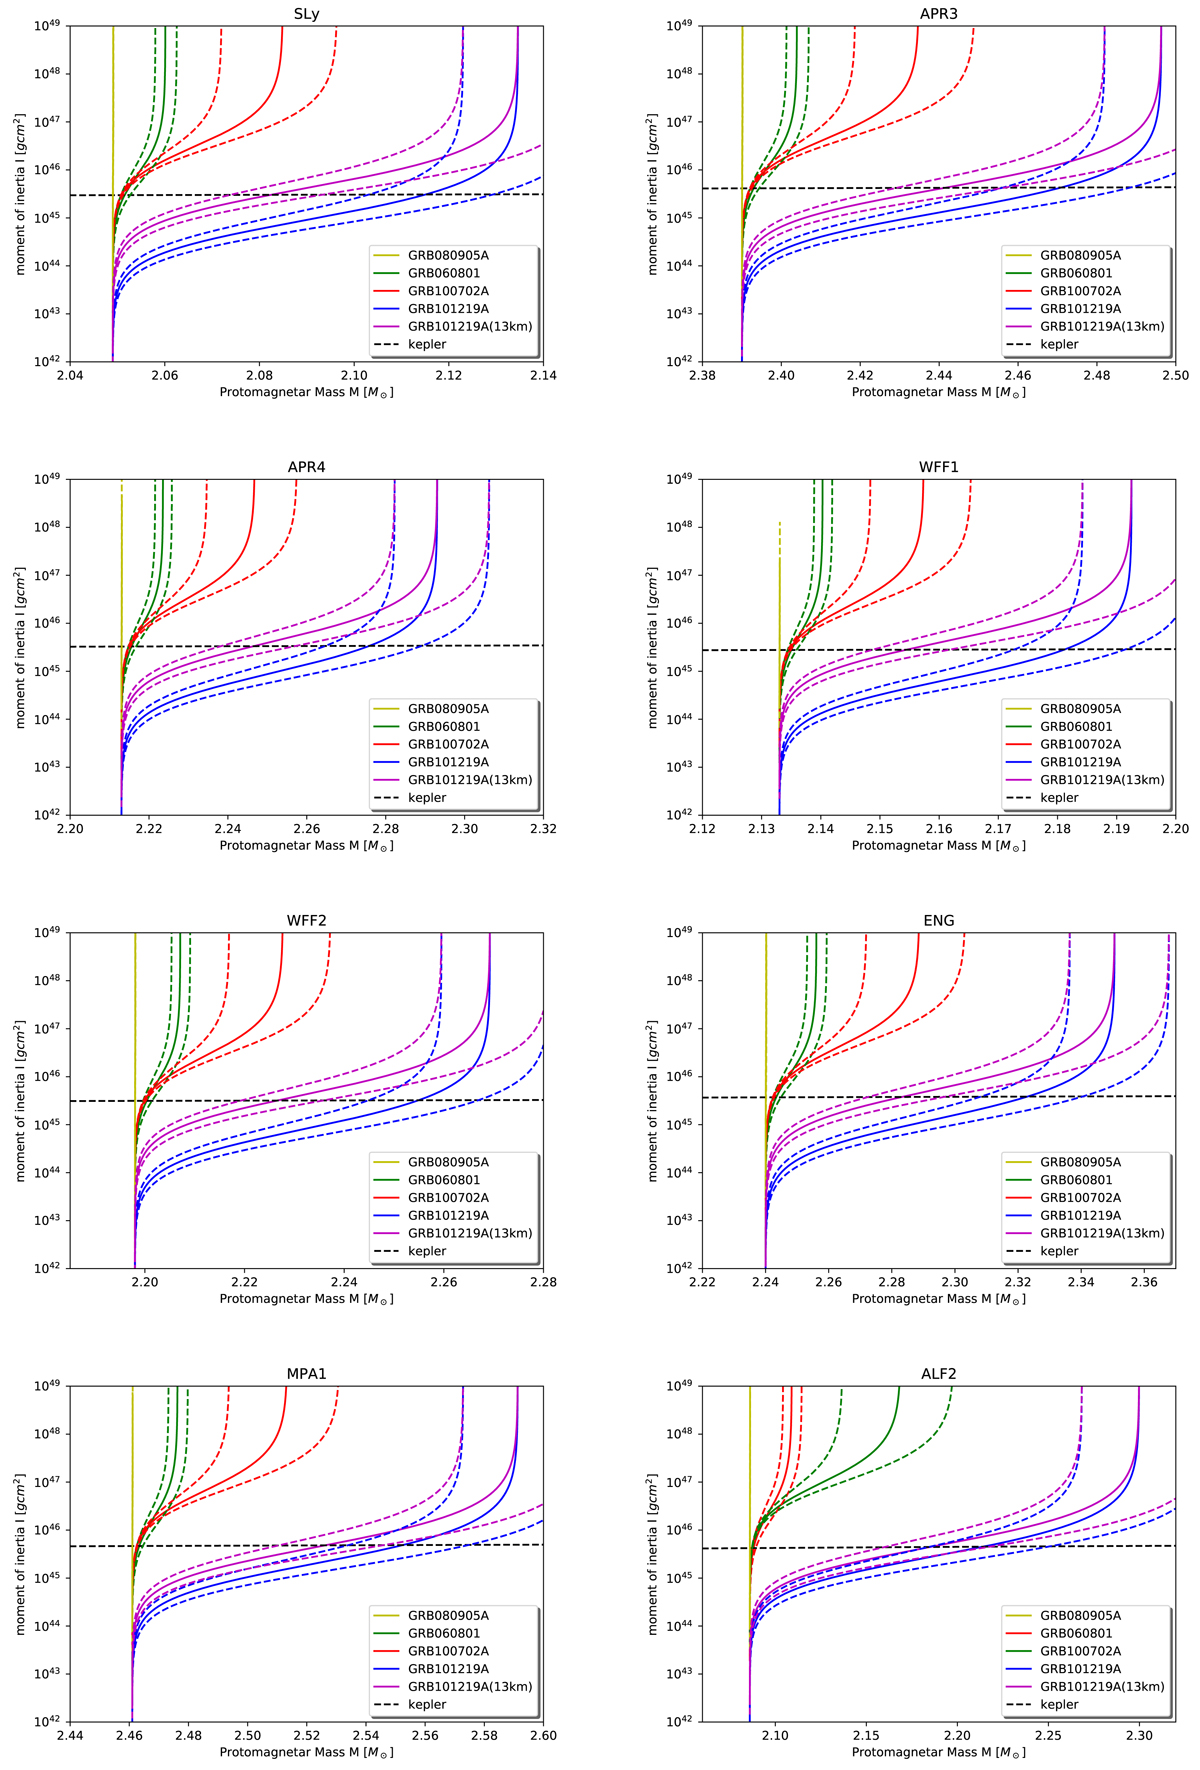
Moment of inertia as a function of the protomagnetar mass for eight EOSs using four sGRB samples. GRB 080905A is shown in yellow, GRB 060801 in green, GRB 100702A in red, and GRB 101219A in blue. We also plot the results with a radius of 13 km for GRB 101219A (magenta). Each group of curves has three lines. The middle solid lines correspond to the best-fit (Pi, Bp) values, and the bottom and upper dashed lines take the error of the fitting results into account. Detailed data are listed in Table 3. The eight EOSs are SLy, APR3, APR4, WFF1, WFF2, ENG, MPA1, and ALF2. In each EOS panel, the dashed black line represents the relation of the moment of inertia and mass in the case of Keplerian rotation. The intersection parts represent the theoretical mass of the nascent NS.
Current usage metrics show cumulative count of Article Views (full-text article views including HTML views, PDF and ePub downloads, according to the available data) and Abstracts Views on Vision4Press platform.
Data correspond to usage on the plateform after 2015. The current usage metrics is available 48-96 hours after online publication and is updated daily on week days.
Initial download of the metrics may take a while.