Free Access
Fig. 8.
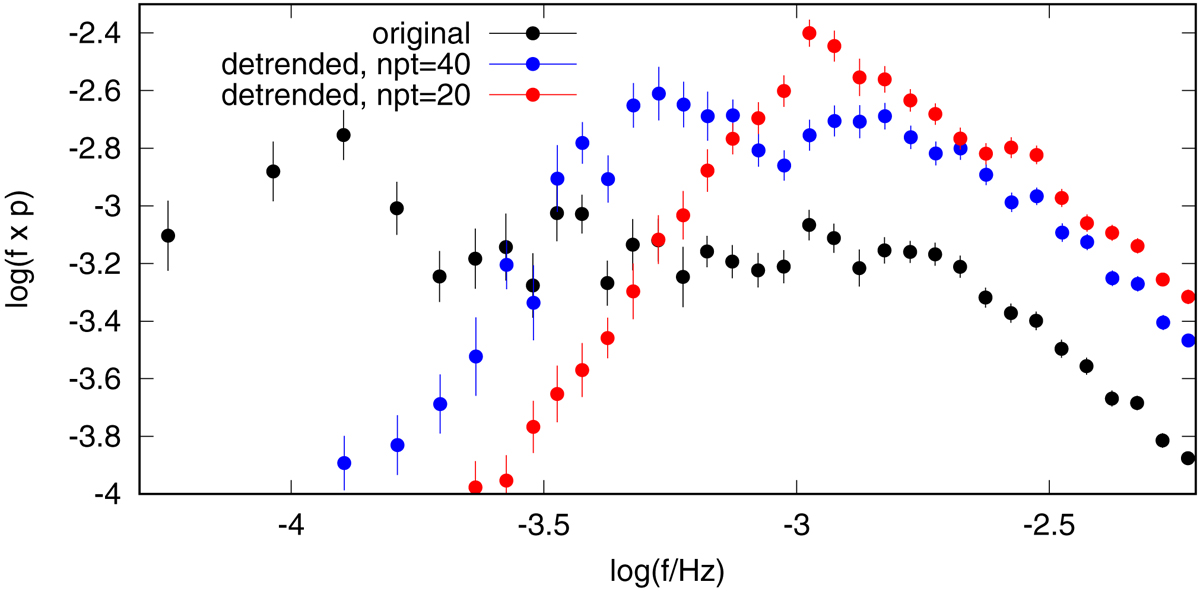
Power density spectra from the first ten days of Kepler data. We compare the original case with two PDSs calculated from data after detrending using the running median. The number of median window points is represented by npt.
Current usage metrics show cumulative count of Article Views (full-text article views including HTML views, PDF and ePub downloads, according to the available data) and Abstracts Views on Vision4Press platform.
Data correspond to usage on the plateform after 2015. The current usage metrics is available 48-96 hours after online publication and is updated daily on week days.
Initial download of the metrics may take a while.