Free Access
Fig. 7.
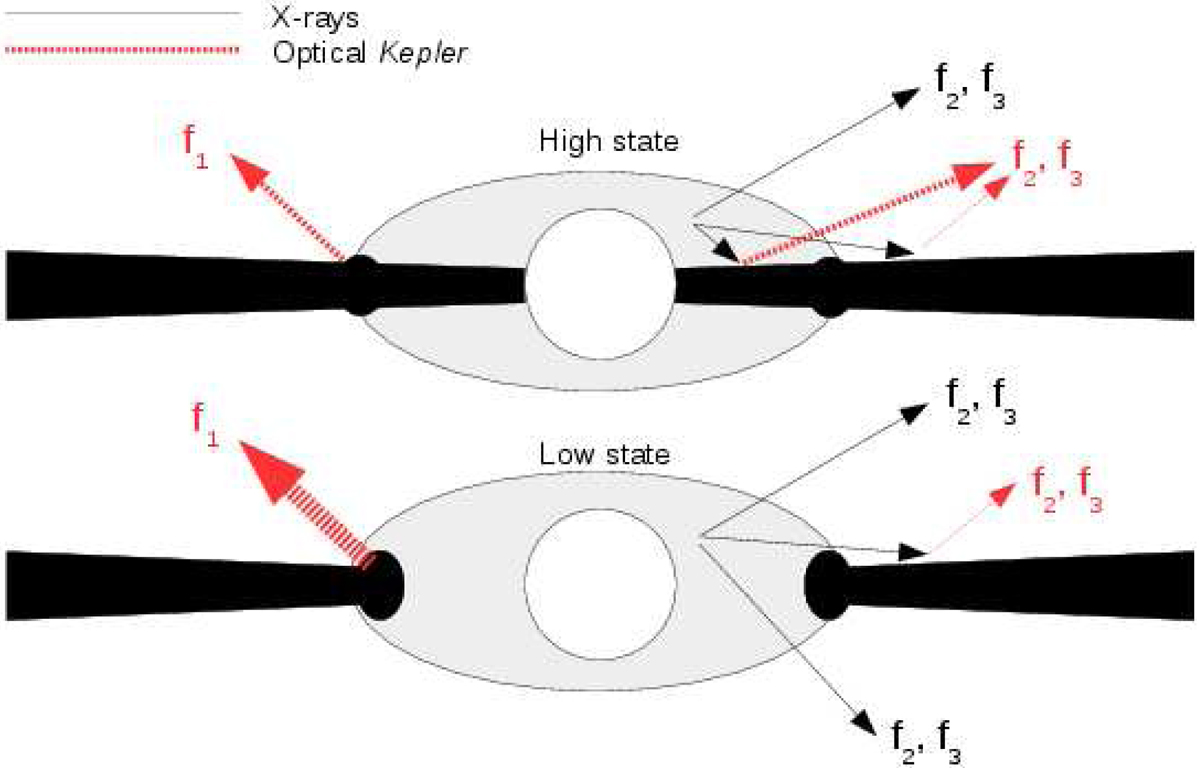
Visualization of the proposed scenario, where f2 and f3 components are generated in the hot corona as X-rays that are reprocessed into optical radiation by the underlying thin disk. The thickness of the arrows represents the radiation intensity. The text gives details.
Current usage metrics show cumulative count of Article Views (full-text article views including HTML views, PDF and ePub downloads, according to the available data) and Abstracts Views on Vision4Press platform.
Data correspond to usage on the plateform after 2015. The current usage metrics is available 48-96 hours after online publication and is updated daily on week days.
Initial download of the metrics may take a while.