Fig. 6.
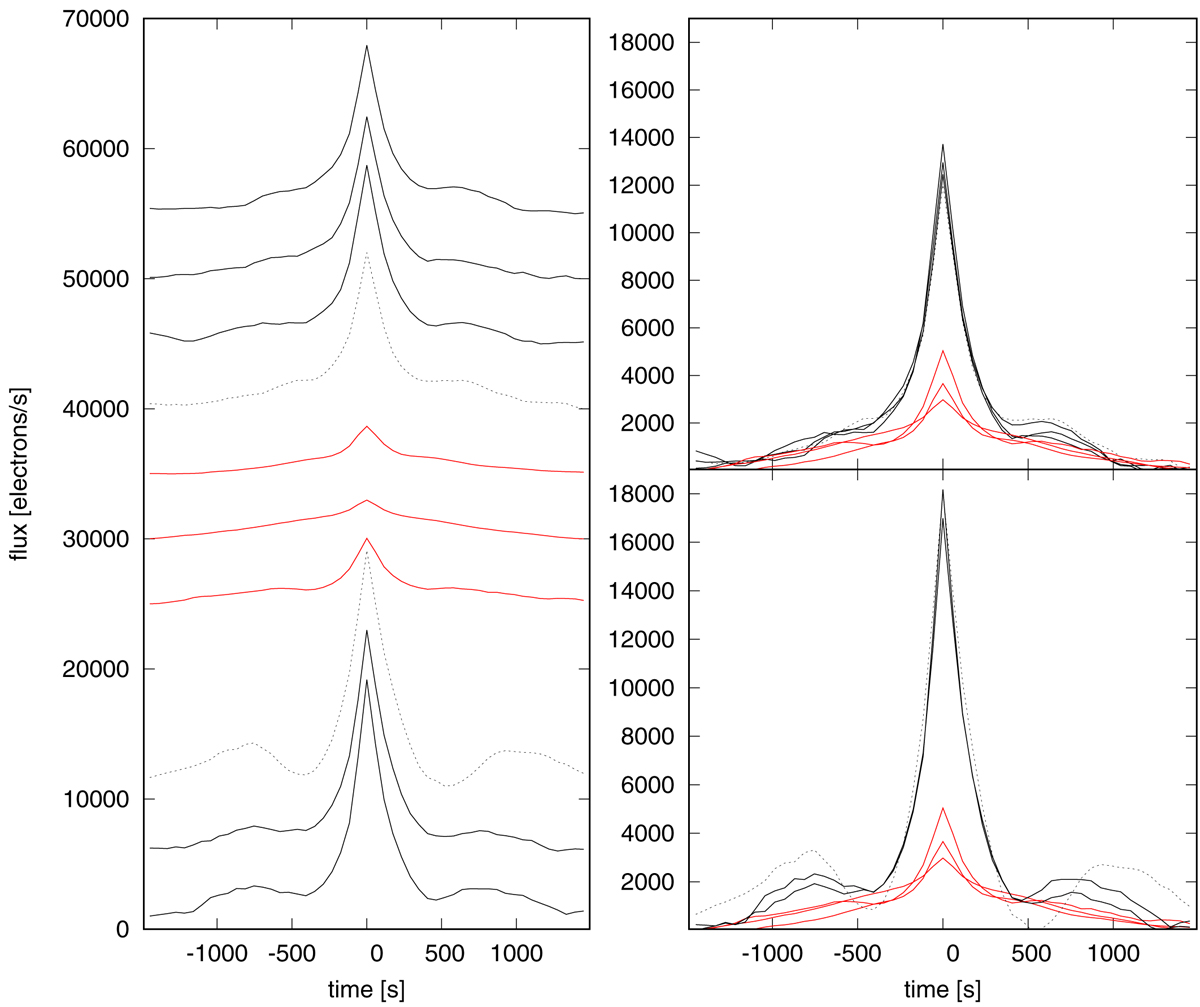
Averaged shot profile time evolution. Black solid lines represent shot profiles during the high state, the black dotted lines are the profiles during both transitions, and the red solid lines represent the low state. Left panel: profiles vertically offset with time elapsing from up to down. Right panels: direct comparison and superposition of profiles showing accession to the low state (upper panel), and ascension from the low state (lower panel).
Current usage metrics show cumulative count of Article Views (full-text article views including HTML views, PDF and ePub downloads, according to the available data) and Abstracts Views on Vision4Press platform.
Data correspond to usage on the plateform after 2015. The current usage metrics is available 48-96 hours after online publication and is updated daily on week days.
Initial download of the metrics may take a while.