Free Access
Fig. 2.
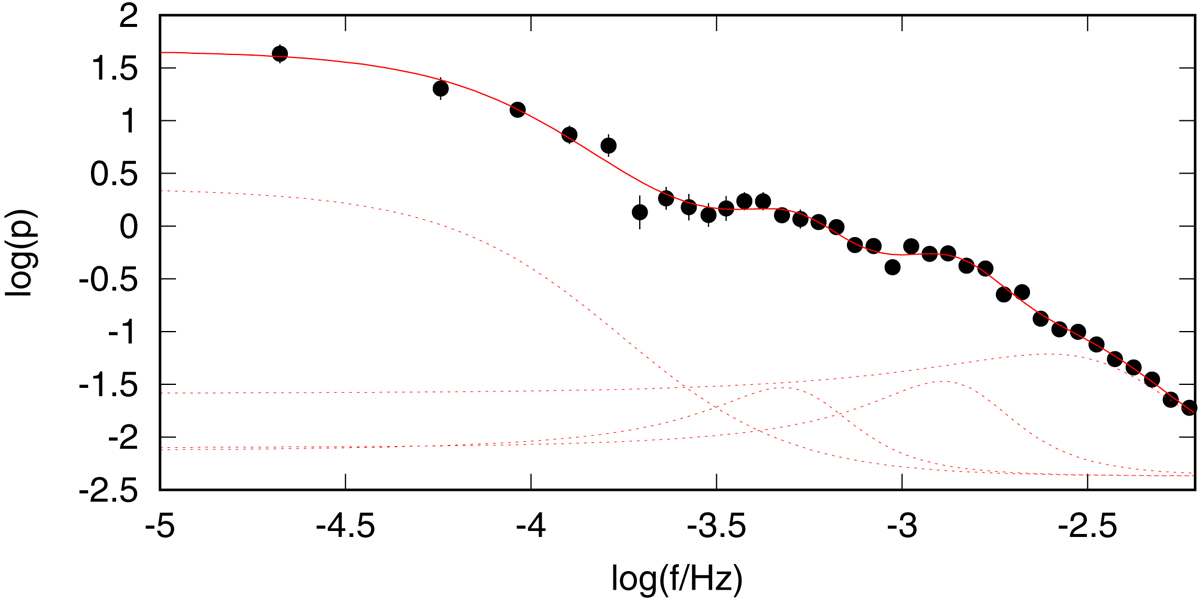
Example of individual Lorentzian components (red dashed line) from Eq. (1) yielding a multicomponent shape of the fit (red solid line). While the fitting is performed in log(p) vs. f, the individual PDS “humps” are better seen in log(f × p) vs. log(f) (see such an equivalent in Fig. 4, day 110–120).
Current usage metrics show cumulative count of Article Views (full-text article views including HTML views, PDF and ePub downloads, according to the available data) and Abstracts Views on Vision4Press platform.
Data correspond to usage on the plateform after 2015. The current usage metrics is available 48-96 hours after online publication and is updated daily on week days.
Initial download of the metrics may take a while.